Arizona solar / San Tan Valley
San Tan Valley became a town. Your solar permit has not moved yet.
Written by the Solar Learning Lab research deskUpdated August 25, 202611 min read
Almost everything written about solar in San Tan Valley is now out of date on the first fact. The place incorporated as a town on September 17, 2025 and took over municipal services on July 1, 2026. But if you file a rooftop solar application today, it still goes to Pinal County, which reviews, permits, inspects, and signs off under an intergovernmental agreement that runs through December 31, 2026. Getting that wrong sends homeowners to the wrong counter.
Until December 31, 2026, submit to Pinal County. The Town stacks a $75.00 solar processing fee on top of the county's per-kW schedule. On January 1, 2027, the Town's own building code takes over, based on the 2024 I-codes.
Know your reviewer before you sign
A bid written for the wrong code year or the wrong counter costs you a correction cycle. Here is the handover timeline in plain terms.
See the county-to-town handover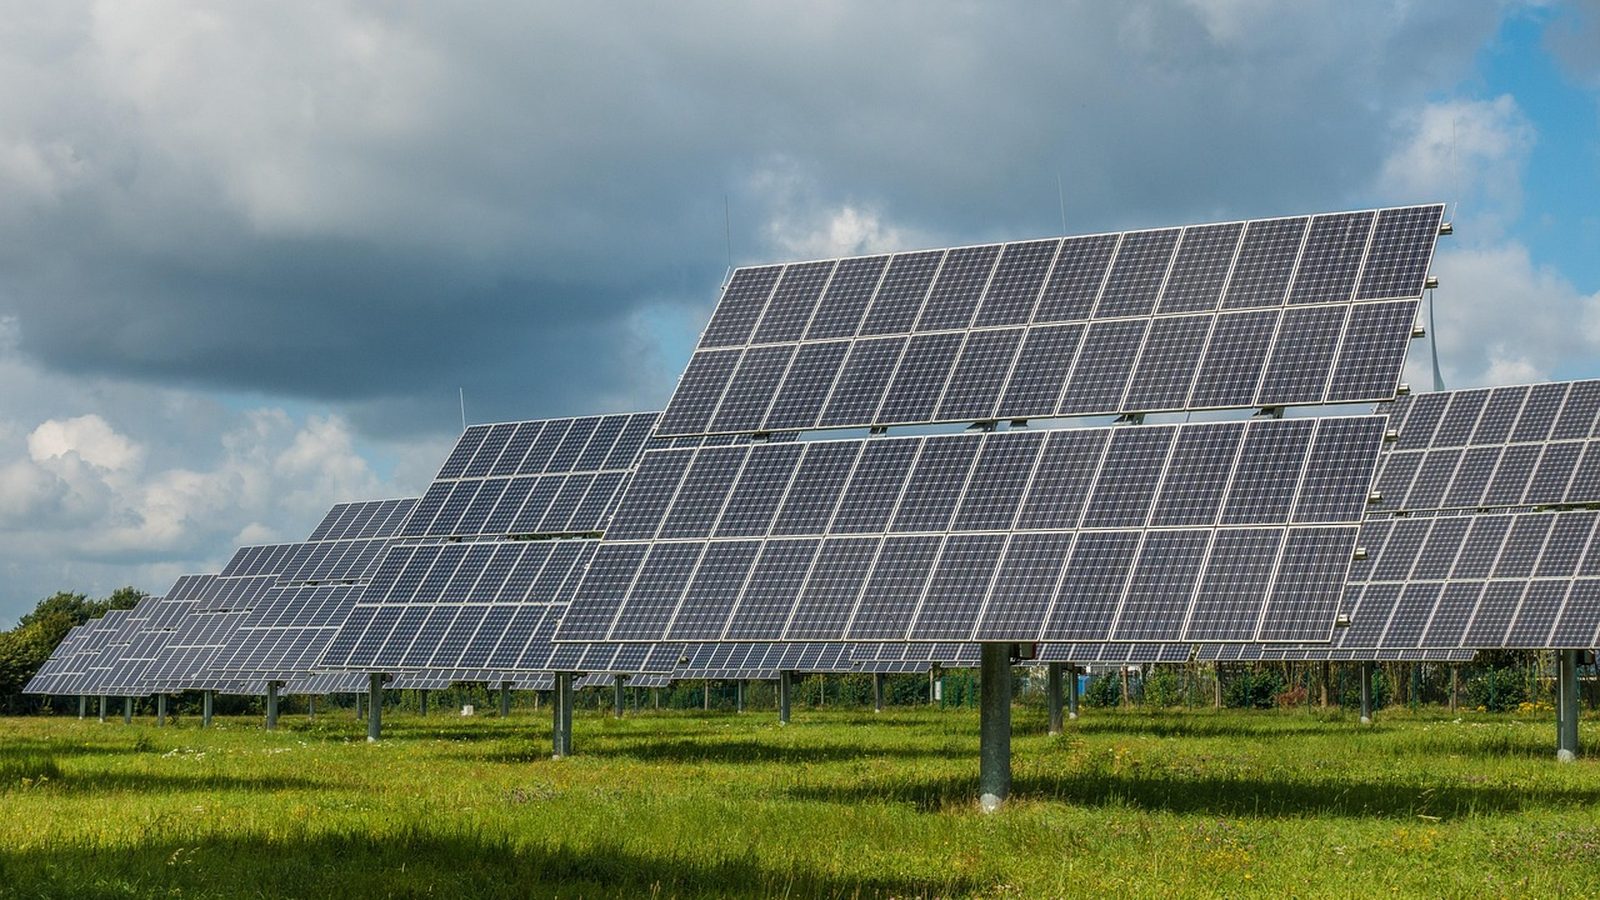
Photo: mrganso, via Pixabay
Last day Pinal County issues permits under the IGA
Households heating with electricity, the highest share in our city dataset
Single-family share of the housing stock
A three-date handover, and each date changes something specific
Date one: September 17, 2025, incorporation. The Pinal County Board of Supervisors approved the resolution and appointed a seven-member council, sworn in September 25 at Central Arizona College's San Tan campus, with elections aligned to the August 4, 2026 primary. The county announcement covers the timeline.
Date two: July 1, 2026. The Town assumed municipal services, plus zoning, land use, subdivision, and development review inside town limits. Building permits are the exception. Under an IGA executed under A.R.S. 11-863 and 11-952, Pinal County keeps doing plan review, permitting, inspection, final approval, and Certificates of Occupancy through December 31, 2026, with fees paid directly to the county. Right now your plan set is reviewed against county codes based primarily on the 2018 I-codes. The building-safety transition notice and the IGA itself are both public.
Date three: January 1, 2027. The Town's adopted building code governs, built on the 2024 International Codes with local amendments referencing the 2023 NEC, and county-approved standard plans stay valid until March 1, 2027. An installer quoting you this fall should be able to say which side of that line your inspection will land on. If they cannot, that tells you something. The League of Cities town profile lists the adopted amendments.
The permit math is published, so make bidders show it
Pinal County prices residential solar by system size: a $42.00 issuance fee, then $13.60 per kW from 1 to 5 kW, $12.50 per kW from 6 to 10, $11.70 from 11 to 20, and $11.00 at 21 kW and up. Plan review adds 65 percent of the building permit fee at submittal, and the Town's IGA exhibit adds its $75.00 solar processing fee for roof or ground mount. No mystery, no flat guess. Anyone hand-waving "permit costs" in a San Tan Valley bid is choosing not to read a public table. The county fee schedule and the IGA fee exhibit.
The submittal standard is also public. Information Bulletin 021 spells out the county's residential PV requirements: at least two access pathways on separate roof planes, one reachable from the street or driveway side, each 36 inches wide from roof edge to ridge. Arrays covering not more than 33 percent of the plan-view roof area need an 18 inch clear setback on both sides of the ridge; go past 33 percent and it becomes 36 inches, per 2018 IFC Section 1204. Plan notes must cite NEC 2017, specifically 690, 705-10, 690-13, 690-31, and 690-54. Bulletin 021 is the document to hand your designer.
Two quirks worth knowing before you file. Solar permits go through the county's Citizen Access Portal, which caps online submittals at 3 applications per applicant or contractor per day depending on workload. And PV on a modular or mobile home roof requires a sealed certification letter from an Arizona registered engineer under the 2018 IRC and IBC, a real gate given the local manufactured-home stock. The online submittal bulletin covers the portal rules.
This is the most electric-heavy housing stock we have profiled
In our Census dataset, 62.1 percent of San Tan Valley households heat with electricity, the highest share of any city we have covered, and 95.6 percent of the housing stock is single family. Owner occupancy runs 82.2 percent in the QuickFacts profile, against a median owner-occupied value of $410,100. Put those three together and you get something rare: a market where nearly every roof has an owner who can say yes, and nearly every meter carries electric load in both seasons. The Census profile and ACS data back each figure.
Why does electric heat matter in a desert? Because it flattens the seasonal gap. A gas-heated Phoenix-area home is a summer-only electric story. An electric-heated one keeps buying kWh through the winter, when the Phoenix normals still average out to a 75.6 degree annual mean and just 7.22 inches of rain. Winter consumption gives December and January production somewhere useful to go, which matters a lot under SRP's export pricing, covered next. This is a fast-growing place too: 99,894 people at the 2020 Census, up 22.9 percent from 81,321 in 2010. NWS Phoenix normals.
One town, two utilities, and a 3.45 cent export credit
Local reporting states the Town of San Tan Valley is served entirely by Salt River Project, with Arizona Public Service picking up the area south of Arizona Farms. SRP's own service-area page is an address-lookup tool, not a boundary map, so verify your specific address before trusting any rate on this page. The local coverage and SRP's lookup.
| Energy source | Type | Average price | What that means |
|---|---|---|---|
| SRP | 2024 average residential price, EIA-861 | 13.46¢ per kWh | A benchmark, not your plan rate. |
| SRP TOU Export | Summer peak on-peak energy charge | 23.38¢ per kWh | Off-peak in the same season is 11.19 cents. |
| SRP Conserve 6 to 9 p.m. | Summer peak on-peak, comparison table | 40.26¢ per kWh | The top of SRP's published on-peak range. |
| SRP export credit | Exported generation | 3.45¢ per kWh | Fixed, with delivered and exported kWh metered separately. |
Look at the spread. On-peak retail reaches into the 20 to 40 cent range depending on plan, and every exported kWh earns a fixed 3.45 cents. SRP's solar lineup splits into demand plans like Customer Generation, where energy charges are about half the TOU rate but a per-kW demand charge keys off 30 minute on-peak intervals, and export plans with no demand charge and the 3.45 cent credit. On-peak windows are weekday 5 to 9 a.m. and 5 to 9 p.m. from November through April, and weekday 2 to 8 p.m. from May through October. The play is the same on either plan family: consume your own production, shift load out of the peak window, and treat export revenue as a rounding error. Customer Generation details.
South of Arizona Farms the story is APS, where the Corporation Commission voted on August 12, 2026 to cut the solar export rate 10 percent to 5.5 cents per kWh, the maximum annual decline its rules allow. Advocates note APS households pay 34 cents per kWh in summer evening hours against that 5.5 cent credit. Different utility, identical conclusion. Vote Solar's account and AriSEIA coverage.
Peak production lands in May, and that is normal for the desert
May leads the model at 173.9 kWh per kW; July heat derates the panels.
PVGIS v5.2. PVGIS v5.2 model run by Solar Learning Lab on August 25, 2026, NSRDB radiation database. Fixed south facing mount, 30 degree tilt, 14 percent losses, downtown San Tan Valley coordinates. Your roof will differ.
Our PVGIS run estimates 1,814.9 kWh per kW per year at San Tan Valley coordinates. Notice the shape: May at 173.9 beats July at 149.4, because panel efficiency drops as cell temperature climbs. The curve stays remarkably flat though, and December at 124.7 is nothing like a winter collapse. Pair that flat curve with the electric-heat load profile above and winter production in this market is not stranded, it is consumed. That combination is the quiet argument for San Tan Valley penciling better than its 13.46 cent average rate suggests.
The $1,000 credit is the headline now, so state it honestly
With the federal 25D credit repealed for expenditures after calendar year 2025, the remaining direct tax incentive here is A.R.S. 43-1083: 25 percent of the device cost, capped at $1,000 per taxable year and capped at $1,000 in aggregate for the same residence, with a five year carryforward. Married taxpayers filing separately may each claim half. Say the cap out loud. A quote that implies "25 percent off" the full system price is misleading a customer about a $1,000 credit. The statute and the CRS federal summary.
Two quieter provisions still help. Under A.R.S. 42-11054(C)(2), grid-tied photovoltaic systems are considered to add no value to the property, so the array does not raise your assessment. And A.R.S. 42-5061 deducts solar energy device sales from the transaction privilege tax base when the retailer is registered as a solar energy retailer. On the utility side, SRP lists a $250 demand management system rebate for solar customers as a limited-time offer, a Battery Partner Program with no dollar amount published on the page we reviewed, and a program that buys your renewable energy credits for bill savings. Property tax statute, sales tax statute, and SRP's rebate list.
In a town built of master-planned subdivisions, know A.R.S. 33-1816
San Tan Valley is subdivision country, which makes one statute the most useful consumer fact in this whole file. An Arizona HOA cannot prohibit the installation or use of a solar energy device. It can adopt reasonable placement rules, but only if they do not prevent installation, impair functioning, restrict use, or adversely affect the device's cost or efficiency. And the prevailing party in a lawsuit under the section collects attorney fees, which is why these fights rarely reach a courtroom. Get the HOA's architectural response in writing and measure it against that language. Read A.R.S. 33-1816.
The local directory is thin, so vet harder
San Tan Valley's installer listings carry small review counts, some in the single digits, which is what a brand-new town looks like in a ratings feed. Low volume is not a verdict either way. It does shift the burden to your questions: which counter gets the permit before January 1, 2027, does the bid line-item the county per-kW fee plus the $75.00 town processing fee, and which named SRP plan does the savings model assume?
Ratings snapshot: Google Maps, August 2026, via the DataForSEO SERP feed. Zero companies paid us and none are endorsed by us.
GoGreen Daylight Systems LLC | Tubular Skylights & Solar Tubes
5.0(38 Google reviews)
Signature Solar Solutions LLC
4.5(16 Google reviews)
B Green Energy Solutions
5.0(14 Google reviews)
Sun Solar LLC
4.3(6 Google reviews)
StarQuest Solar
5.0(4 Google reviews)
Progeny Power LLC
Queen Creek, AZ
5.0(3 Google reviews)
Ratings and review counts are Google Maps ratings for San Tan Valley local results, retrieved August 17, 2026 via the DataForSEO SERP API. We list the highest rated established companies we found. No company paid to appear here, and appearing here is not an endorsement. Check current reviews and licensing before you sign anything.
Estimate a San Tan Valley system
The top of the range is our fixed south-facing PVGIS model at San Tan Valley coordinates. The bottom is 85 percent of that annual figure. Desert heat derates panels in July and August, which is why May, not midsummer, is the peak month.
Cash quotes in San Tan Valley cluster near $2.20 per watt, against a $3.50 national 2024 median (LBNL). Use your quote.
Assumptions you can change
Use the rate on your actual lease or PPA quote. There is no published statewide average we trust enough to hardcode.
Cash purchase
$16,380 after state credit
- Year 1 benefit
- $161/mo
- Payback
- 8 years
- 20 year net position
- $30,452
The direct incentives left for 2026: Arizona's 25 percent credit capped at $1,000 in aggregate per residence, the A.R.S. 42-5061 sales tax deduction, and the rule that a grid-tied system adds no taxable value to the home. The federal homeowner credit ended after 2025.
Solar loan
$232/mo 15 yr payment
- Year 1 net
- -$72/mo
- Upfront
- $0
- 20 year net position
- $4,993
Financed pricing keeps the Arizona cost baseline. Before signing, get the SRP plan named in writing, because a demand-charge plan and an export plan produce different savings from the same array.
Lease / PPA
$0 down you buy the power
- Year 1 net
- -$126/mo
- Upfront
- $0
- 20 year net position
- -$32,659
48E belongs to the commercial side of a third-party deal and is not a homeowner credit. Judge a lease against SRP's fixed 3.45 cent export credit and your own daytime use, not a percentage a salesperson quotes.
Estimates, not quotes. Inputs use SRP's 2024 EIA average residential price, our San Tan Valley PVGIS run, and EnergySage Arizona cost data. Addresses south of Arizona Farms may be APS, so verify the provider before trusting any rate. We are a solar installer and we also partner with other solar companies. See our disclosures.
What San Tan Valley homeowners actually ask
Who issues my solar permit right now?
How much will the permit cost?
Is my house on SRP or APS?
What incentives can I still get in 2026?
Can my HOA reject the array?
Does putting panels on a manufactured home change anything?
San Tan Valley records we worked from
townProfile · townSite · buildingTransition · planningTransition · iga · incorporation · pvBulletin · onlineSubmittals · countyFees · hoaStatute · propertyTax · salesTax · stateCredit · srpServiceArea · srpCustomerGeneration · srpTouExport · srpComparePlans · srpRebates · utilityNews · apsExportVote · apsCoverage · eia2024 · federal · quickfacts · climate · census · pvgis
Talk through a San Tan Valley project
We are a solar installer and we also partner with other solar companies. Bring your bill and your address; with the SRP and APS line nearby and a permitting handover dated January 1, 2027, both details change the answer.
What does your monthly electric bill look like?
Arizona average is $167 per month (EIA, 2024).