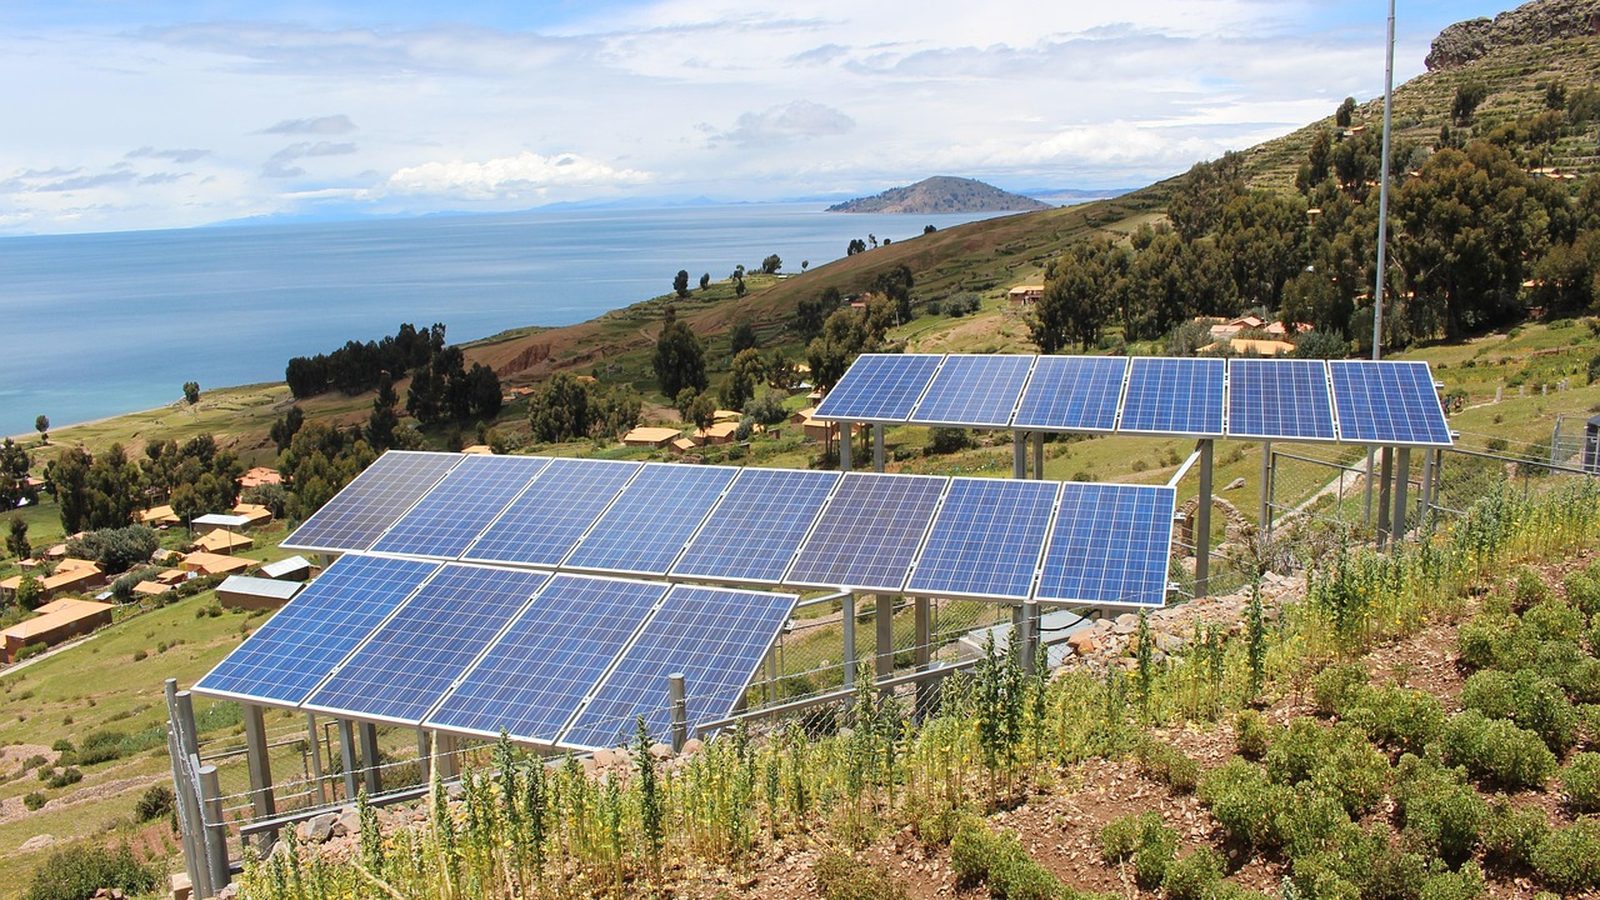
Photo: FotografoAficionado, via Pixabay
California · El Monte
Solar in El Monte: price it before someone knocks
Written by the Solar Learning Lab research deskUpdated August 25, 202612 min read
Let us be blunt about who this page is for. El Monte's 2023 median household income was $64,484, the poverty rate 17.2 percent, and only about four in ten occupied homes are owner occupied. This is not a market where a five figure loan pitched at the front door deserves the benefit of the doubt. It is a market where the right solar decision might be a smaller system, an income qualified program, or a polite no. The sun here is genuinely good. The sales tactics often are not.
El Monte also has a quirk that makes quote checking harder than in neighboring cities: the City publishes no photovoltaic permit fee line item at all. The government cost of your project gets assembled from an issuance fee, valuation based building charges, plan check percentages and state surcharges. When a salesperson names a single confident permit number, they are estimating, whether they admit it or not. This page shows you the pieces so you can estimate better than they do.
Get a number before the pitch
Two minutes with our estimator gives you a baseline to test any door knock offer against.
Run the El Monte numbersRead the demographics before the brochure
Per the 2020 census, 39.9 percent of El Monte's occupied homes are owner occupied and 60.1 percent are rented, which makes this a majority renter city where most residents cannot sign a rooftop contract even if they want one. The population has been sliding, from 115,965 in 2000 to 109,450 in 2020, and the state's 2026 estimates count 16,869 single detached houses out of 30,727 total units, with households averaging 3.5806 people, the largest of any city in this batch. Big households on modest incomes mean electricity is a real budget line, which cuts both ways: savings matter more, and a bad loan hurts more.
Here is the tension nobody puts in a flyer. Our production model actually gives El Monte solid numbers, and the research behind this page found the city holds the highest modeled in plane irradiation of the three neighbors we covered this week. Good sun does not automatically mean good economics for a specific household. A $64,484 median income market is exactly where lightly regulated financing does its damage, because the monthly payment pitch sounds like relief. Slow down. The roof is not going anywhere.
No PV line item exists, so the fee is a build
We looked. The fiscal year 2026 to 2027 Building Permit Fee Schedule, effective July 1, 2026, contains no photovoltaic line item. What exists instead is a set of parts. The mechanical and electrical permit application lists "Any photovoltaic installation" among the systems requiring a complete electrical plan check and sets a $51.69 issuance fee per type of permit. The building permit fee runs on a valuation table: $122.61 plus $31.57 for each additional $1,000 of value in the bracket over $700 up to $25,000, with higher brackets beyond. Standard plan check is 85 percent of the building permit fee with a $153.50 minimum. State surcharges stack on: the Strong Motion Instrumentation tax at 0.013 percent of residential valuation, a green building fee starting at $1.00, and a 10 percent permit fee increase for work required to comply with California Energy Commission rules. Fees also rose 3.4 percent this cycle under Resolution No. 10313, tied to the regional CPI.
The good news is a ceiling the City did not write. Government Code 66015 sets a $450 ceiling on residential photovoltaic permit fees through 15 kW, with $15 allowed for each kW past that, unless a city adopts a written finding supported by substantial evidence. We found no such finding for El Monte, and no streamlining ordinance either; the City's operational answer to state solar law is its SolarAPP+ page rather than a quotable local code section. So when the permit portion of a quote lands above $450 on a normal residential system, the statute, not the valuation table, is your reference point.
Practical move: ask your contractor for the City invoice, not their summary of it. In our experience the "permits and inspections" line on a sales proposal in a no-line-item city is the single most padded number on the page, precisely because it is the hardest for a homeowner to verify.
The automated lane is real, narrow, and contractor only
El Monte runs residential solar through SolarAPP+: licensed contractors submit the rooftop PV design for automated review, then apply through the City's Tyler EnerGov CSS portal using the SolarAPP+ Residential Solar Permit record type, supply the approval number and three contacts, and pay through MyGovPay for an auto issued permit. The City's SolarAPP+ page spells out the fences: rooftop systems on permitted main dwelling structures only, no ballasted systems, no ground mounts. SolarAPP+ and NREL charge their own processing fee on top of City fees, covering up to three revisions. The City frames the lane as being for licensed contractors and says nothing about an owner builder path, so assume there is not one.
Everything outside that lane meets El Monte's analog side. The Permit Applications page requires in person submittal, with counter hours Monday through Thursday, 8:00 a.m. to 4:00 p.m. and a 3:00 p.m. last sign in. A main panel upgrade, common on this city's older housing, is handled in person. That contrast is worth pricing into your schedule: the panels may permit themselves in software while the panel upgrade waits for a counter visit.
For the record, the state obligation behind all this is Government Code 65850.52, and the CEC tracker updated August 3, 2026 records El Monte's platform status as SolarAPP+, shows 2024 annual report data filed, and notes $80,000 in CalAPP funding awarded April 18, 2023. Installers designing here also get published criteria to work from: Climate Zone 9, Seismic Design Category D or D2, 95 mph three second gust wind at Exposure B, under the 2025 California Building Standards Code with Los Angeles County amendments effective January 1, 2026, per the Building Safety page.
One seller on the bill: SCE, bundled
El Monte is SCE territory per the utility's communities served index, baseline region 9, and it sits on no community choice aggregator's roster per SCE's CCA list. Unlike Downey a few miles south, there is no Clean Power Alliance layer to untangle: generation and delivery both come bundled from SCE. Across its residential customers, SCE's 2024 average price was 32.4 cents per kWh in EIA's data, and the residential plan menu runs TOU-D-4-9PM and TOU-D-5-8PM, plus TOU-D-PRIME, per SCE's plan page.
| Energy source | Type | Average price | What that means |
|---|---|---|---|
| TOU-D-4-9PM summer | June to September weekday | 34¢ off peak, 58¢ on peak per kWh | The 4 to 9 p.m. on peak drops to 48¢ after the $0.10 baseline credit. |
| TOU-D-4-9PM winter | October to May | 33¢ to 51¢ per kWh | Super off peak 8 a.m. to 4 p.m. at 33¢ is when your panels produce most. |
| TOU-D-5-8PM summer | June to September | 34¢ to 74¢ per kWh | The short 5 to 8 p.m. peak carries the menu's highest posted price. |
| Your panels | energy used as it is made | cancels that hour's rate per kWh | Daytime self-consumption is where the money is. Exports get the separate treatment described below. |
SCE time of use plan page, posted rates. Both metered TOU plans also carry a $0.79 per day Base Services Charge.
Notice the shape of the problem: winter super off peak pricing from 8 a.m. to 4 p.m. is the cheapest power on the sheet, and it coincides with peak solar hours. That is the tariff quietly telling you midday production is worth the least. A household that moves cooking, laundry and any EV charging into daylight captures more value from a smaller array, which on this income map is the whole game.
The resource is not the problem
Modeled at downtown coordinates, an El Monte roof yields 1,695.1 kWh per year per installed kW. August leads at 167.4 kWh per kW, December trails at 112.7, and the months in between step smoothly. For orientation, that annual figure edges out West Covina next door and trails Downey slightly, so nobody should choose or skip solar in this corridor over the resource. The decision lives in the financing and the household's daytime usage, not the sky.
August models at 167.4 kWh per kW. July and August together are the test of whether cooling load lines up with production in your house.
PVGIS v5.2 model run by Solar Learning Lab on August 25, 2026, NSRDB radiation database. Fixed south facing mount, 30 degree tilt, 14 percent losses, downtown El Monte coordinates. Your roof will differ. Model documentation is at PVGIS. Between the San Gabriel River and the Rio Hondo the terrain is flat, per the city profile, so shading here is about trees and neighboring structures, not hills. An installer quoting you should still verify the specific roof rather than waving at a city average, including ours.
Exports pay avoided cost, and the equity adder is bigger here
New systems interconnect under the Net Billing Tariff from Decision 22-12-056, covering applications since April 15, 2023. The implementing document is clear that production is not netted against consumption: exports earn credits from hourly Avoided Cost Calculator values averaged monthly, weekday and weekend periods tracked separately, trued up annually. Oversizing a system to farm export credits is a losing strategy under these rules, and any El Monte proposal built on a big export assumption deserves a second opinion.
The detail that actually favors this market: the ACC Plus adder on SCE exports is $0.040 per kWh standard, but $0.093 per kWh for low income customers, defined to include CARE and FERA households and resident owners in disadvantaged communities, locked for nine years from interconnection. More than double the standard adder. It phases down 20 percent per year for later cohorts until it reaches zero after year five, and it excludes NEM transfers, purchased homes with existing systems, and mandate driven new construction installs. A CARE household considering solar in 2026 gets meaningfully better export economics than the same roof next door on a standard rate. Few door knock pitches mention this, because it requires asking about your bill discount instead of your credit score.
The programs that fit a $64,484 median income city
Start with what is gone: the 30 percent federal homeowner credit ended for systems completed after December 31, 2025, per the Congressional Research Service. Any 2026 pitch that leans on a federal credit for a purchased system is describing last year. The CRS source is silent on third party ownership, so treat any tax claim attached to a lease or PPA as unverified until the provider documents it.
Now what is live. SGIP's Residential Solar and Storage Equity program opened reservations June 2, 2025 with a $280 million budget, paying low income residential customers $3,100 against each solar kW and $1,100 against each storage kWh, with a one year window after reservation to meet requirements including demand response enrollment. DAC-SASH, which GRID Alternatives administers through 2030, covers CARE or FERA households whose census tract ranks in CalEnviroScreen's top 25 percent, a test that runs address by address. Given this city's income profile, these two programs are not footnotes; for many El Monte households they are the difference between solar making sense and not. The property tax new construction exclusion also still applies through its January 1, 2027 sunset, so a qualifying system does not raise your assessed value.
The door knock checklist, five questions long
Door to door solar sales concentrate where bills are painful and financing approvals are easy. If someone is on your porch with a tablet, run these five checks before signing anything. One: get the cash price and the financed price in writing; the gap is the dealer fee, whatever they call it. Two: ask whether the quote assumes export credits, and how many; under the Net Billing Tariff those are avoided cost credits, not retail. Three: if anyone mentions a tax credit on a 2026 purchase, the pitch is stale; the homeowner credit ended December 31, 2025. Four: ask whether they screened you for CARE or FERA and the SGIP equity program; a seller who skipped that either does not know this market or hopes you do not. Five: ask who pulls the permit and whether the job runs through the City's SolarAPP+ lane, then verify the permit exists before the crew arrives.
None of this is anti solar. It is anti bad-deal. The same roof, financed sensibly and sized to daytime usage, can be a genuinely good purchase in this city. The checklist exists because the person who knocks is rarely the one offering that version.
The local bench is short on reviews. Compensate deliberately.
El Monte's map results are strikingly thin: the listed companies top out at a dozen reviews, and several show fewer than ten. That does not mean no one competent works here; plenty of regional installers serve the San Gabriel Valley without an El Monte storefront. It does mean star ratings carry almost no statistical weight in this list, so lean on license verification, references from completed local jobs and written scopes instead of the rating column.
Solar Solutions 4 U, Inc
South El Monte, CA
3.3(12 Google reviews)
May & Jack Inc: Local solar installer, solar installation company, solar panel & battery factory, C10 licensed
Arcadia, CA
5.0(9 Google reviews)
Lumina Solar
South El Monte, CA
5.0(6 Google reviews)
Solar Unlimited Arcadia
Arcadia, CA
4.3(6 Google reviews)
Solar Warehouse
Rosemead, CA
4.8(5 Google reviews)
EE Systems Group Inc
El Monte, CA
4.0(4 Google reviews)
Ratings snapshot: Google Maps, August 2026, via the DataForSEO SERP feed. Zero companies paid us and none are endorsed by us.
Widen the search radius on purpose. A contractor with deep review history two cities over is usually a better bet than a nearby profile with three ratings, provided they know El Monte's SolarAPP+ lane and its in person counter for everything else.
Run the skeptic's estimate
This calculator will not flatter you. It uses our local production run, the statewide average rate and standard cost inputs, and it ignores every incentive a salesperson might wave around. If the number here looks marginal, make the income qualified programs above do the heavy lifting before you let financing do it.
The high end is our El Monte PVGIS run at 1,695.1 kWh per kW per year. The low end takes 15 percent off for roofs that face the wrong way or catch shade, which is a screening allowance, not a shade report.
Cash quotes in El Monte cluster near $2.46 per watt, against a $3.50 national 2024 median (LBNL). Use your quote.
Assumptions you can change
Use the rate on your actual lease or PPA quote. There is no published statewide average we trust enough to hardcode.
Cash purchase
$8,364 after state credit
- Year 1 benefit
- $160/mo
- Payback
- 5 years
- 20 year net position
- $38,139
El Monte households are on plain SCE bundled service, so the statewide rate input is a reasonable stand-in. What the tool cannot do is tell you whether solar beats simply cutting usage on a tight budget. If the monthly bill is modest, run that comparison first.
Solar loan
$112/mo 15 yr payment
- Year 1 net
- $48/mo
- Upfront
- $0
- 20 year net position
- $26,370
Financed quotes in this market often arrive at the door with the dealer fee hidden inside the panel price. Demand the cash price and the financed price side by side; the gap is what the financing actually costs you, whatever the salesperson calls it.
Lease / PPA
$0 down you buy the power
- Year 1 net
- $44/mo
- Upfront
- $0
- 20 year net position
- $14,550
No federal homeowner credit exists for systems completed after December 31, 2025, and our federal source does not address third party ownership. Judge a lease or PPA by its monthly payment, escalator and buyout table, and get every tax claim in writing or ignore it.
Estimates, not quotes. This tool pairs the California average retail rate with our downtown El Monte PVGIS run and statewide cost data. It cannot compute El Monte's valuation based permit charges, hourly export credits, or income qualified program values. We are a solar installer and we also partner with other solar companies. See our disclosures.
We are a solar installer and we also partner with other solar companies.
El Monte solar, straight answers
Why can't anyone tell me El Monte's solar permit fee up front?
Is there a legal ceiling on what the permit can cost?
Can I use the SolarAPP+ fast lane as an owner builder?
What help exists for lower income households here?
A door to door rep quoted me a federal tax credit. True?
El Monte paper trail
Documents reviewed August 25, 2026. Every fee, rule and rate above traces to one of these.
- El Monte Building Permit Fee Schedule, FY 2026 to 2027, mechanical and electrical permit application, and Resolution No. 10313 fee adjustment
- City SolarAPP+ page, SolarAPP+ step by step guide, Permit Applications page, and Building Safety design criteria
- Government Code 66015, Government Code 65850.52, Civil Code 714, and the CEC permitting tracker
- SCE communities served index, SCE CCA roster, SCE TOU rate plans, and EIA 2024 residential sales
- CPUC Net Billing Tariff and Decision 22-12-056 implementation
- CPUC SGIP equity program, DAC-SASH, BOE property tax exclusion, and CRS IN12611
- DOF E-5 housing estimates, El Monte city profile, and PVGIS
Build an El Monte estimate from your own bill
No pressure, no porch pitch. Answer a few questions and get a range you can measure every offer against.
What does your monthly electric bill look like?
El Monte average is $161 per month (EIA, 2024).