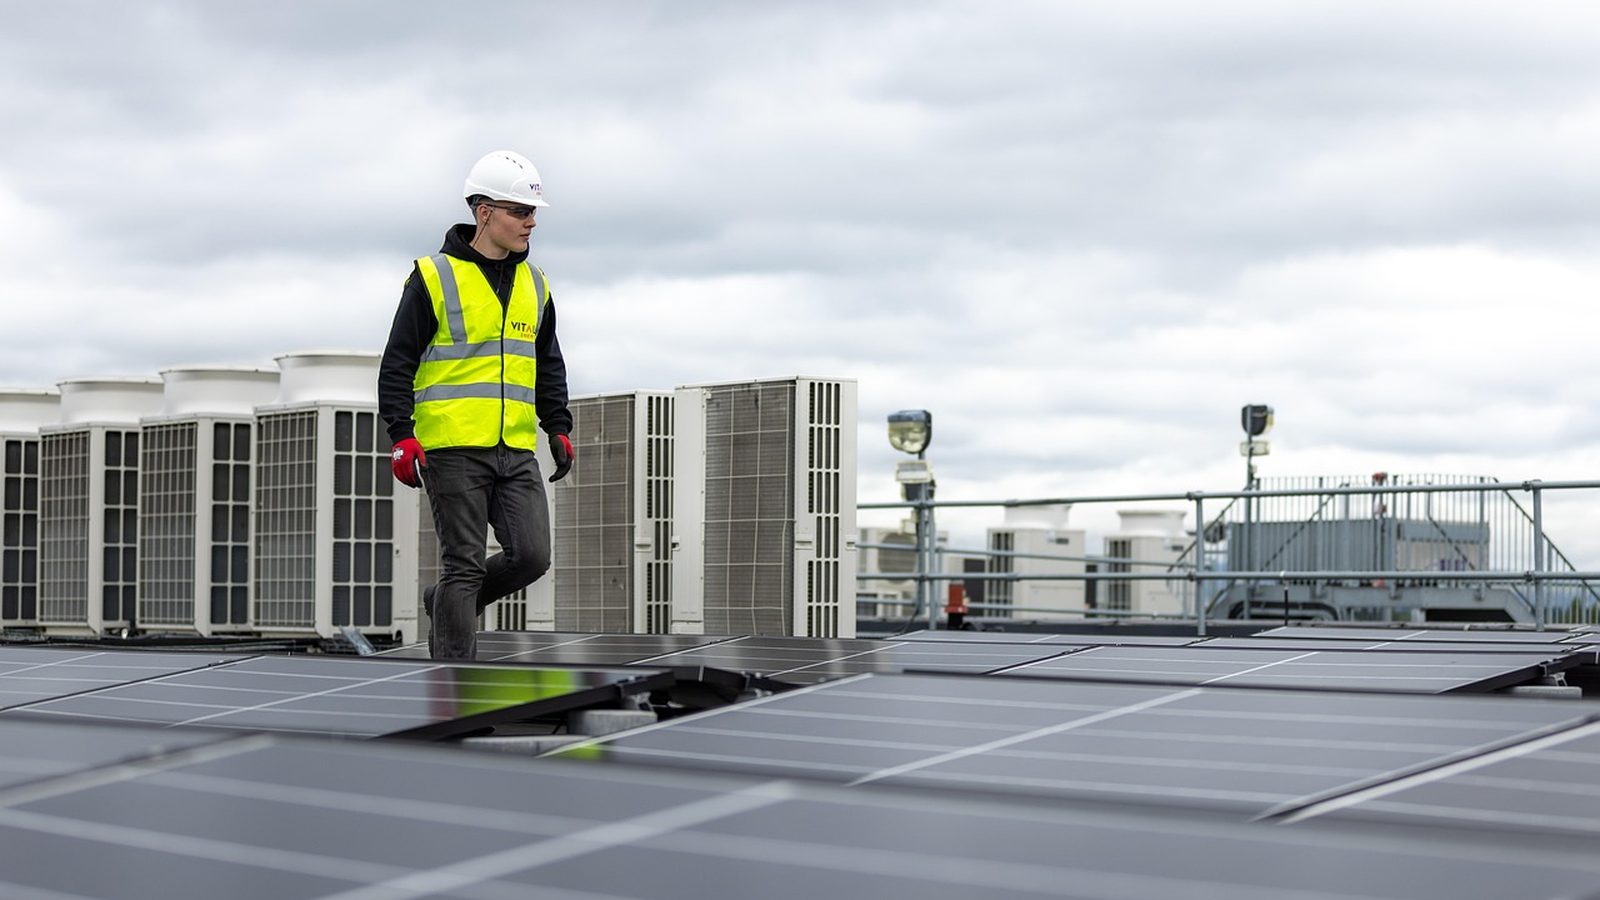
Photo: This_is_Engineering, via Pixabay
California · Redwood City
Redwood City solar: expensive power meets a name change
Written by the Solar Learning Lab research deskUpdated August 28, 202611 min read
Redwood City is the one city in this research batch where the wires belong to PG&E, and that single fact does most of the economic work. PG&E's 2024 bundled residential average came in at 39.6 cents per kWh in EIA Table 6, about 7.2 cents above Southern California Edison. Every kWh your roof produces and your house consumes avoids that price. The catch is that generation service here comes from Peninsula Clean Energy, a CCA that is in the middle of rebranding as WestLight Energy, so the paperwork you read this fall may not carry the name your neighbor remembers.
The slogan on the city seal is "Climate Best By Government Test," from a pre World War I climate survey, per the city's Wikipedia entry. For solar, take that with Peninsula honesty: the fog season is real, and a 20 degree tilt check we ran puts this roofstock at the lowest modeled yield of the five cities we studied this week. Low yield against the state's priciest power is not a contradiction. It is the whole local math problem, and this page works through it.
Pressure test a Peninsula quote
Run your bill and roof through the estimator before anyone turns fog season into a footnote.
Estimate Redwood City solarPeninsula Clean Energy is becoming WestLight Energy. Same wires, same split.
Since 2016, San Mateo County and all 20 of its cities, Redwood City included, have bought their generation through Peninsula Clean Energy, while PG&E continues to own the lines, deliver the electricity and send the consolidated bill. The agency has now announced it is rebranding as WestLight Energy. Expect quotes, bills and program pages to use both names for a while. The structure underneath does not change: WestLight sells you the electrons on paper, PG&E runs the physical grid and the interconnection queue.
The default product is ECOplus, at least 50 percent renewable and 100 percent clean, priced below the comparable PG&E product, with current rates effective July 1, 2026. The agency reports $226 million in cumulative customer savings since 2016 and says it reached 100 percent clean power in 2021, with a target of 100 percent renewable around the clock by 2030, per its background page.
One conflict deserves a plain sentence. ECO100, the 100 percent renewable upgrade at $0.015 per kWh (roughly $6.38 a month for an average 425 kWh household per the rate choices page), is not available to Solar Billing Plan customers at this time. If you want both rooftop panels and a fully renewable supply mix from your CCA, you currently have to pick one. Installers rarely volunteer that.
High rates carry the project. The fog takes its cut.
Our standard PVGIS run at downtown coordinates, 30 degree tilt, models 1,696.2 kWh per year per installed kW. July peaks at 179.6 kWh per kW and December sags to 90.9, a summer to winter swing of nearly two to one. That shape matters under the Net Billing Tariff because the value of a kWh depends on when it shows up, not just whether it shows up.
July is the modeled high month at 179.6 kWh per kW. Whether that production offsets your bill or exports at avoided cost depends on who is home running loads on July afternoons.
PVGIS v5.2 model run by Solar Learning Lab on August 28, 2026, NSRDB radiation database. Fixed south facing mount, 30 degree tilt, 14 percent losses, downtown Redwood City coordinates. Your roof will differ. The run uses the PVGIS tool. We also ran a second check at a shallower 20 degree tilt with building mounted assumptions, and that model returned 1,615.23 kWh per kWp, the lowest figure among the five cities in this research batch, about 5.6 percent below Santa Barbara. Two runs, two answers, one lesson: tilt and mounting assumptions move Peninsula output enough that your installer's production model deserves a line item review, not a nod.
Here is the counterweight. A mediocre solar resource multiplied by 39.6 cent power routinely beats a great solar resource multiplied by cheap power. Redwood City households do not need heroic production to justify a right sized system. They need the production they do get to land against daytime consumption instead of exporting into avoided cost hours.
Permitting: SolarAPP+ in front, E-TRAKiT behind, a person to call
Redwood City directs residential solar applicants to register and submit through SolarAPP+, then finish issuance through the City's E-TRAKiT permit portal, per the City's SolarAPP+ Automatic Permitting page. This is the pattern the state wanted: Government Code 65850.52, added by SB 379, requires an online platform that checks code compliance and issues permits in real time to licensed contractors for residential solar up to 38.4 kW AC, per the statute.
The compliance record is unusually tidy. The CEC tracking file updated August 3, 2026 lists Redwood City on the SolarAPP+ platform, with 2024 annual report data filed and a $60,000 CalAPP grant awarded April 6, 2023. Better still, the City publishes a named program contact: Jonah Glen, jglen@redwoodcity.org, 650-780-7358, on the same page. When an automated submission snags, a direct phone number beats a ticket queue.
The gap is the fee. The City publishes a Master Fee Schedule effective July 1, 2026 through its Revenue Services page, but we could not pull a solar line item from the document itself, so we will not invent one. The statewide ceiling under Government Code 66015 is $450 for residential PV plus $15 per kW above 15 kW unless a city adopts findings to exceed it. Confirm the actual figure with Building Inspection at (650) 780-7350 or permits@redwoodcity.org, listed on the division contact page. Counter hours run Monday through Thursday 10 a.m. to 4 p.m., with a virtual counter Friday.
The addressable roof market is thinner than the income suggests
The state's January 2026 housing estimate counts 33,575 total units in Redwood City, of which 14,517 are single detached, just 43.2 percent, per the Department of Finance E-5 file. Owner occupancy sat at 46.8 percent in the 2020 census, per Wikipedia's summary. Under half. So while this is a wealthy city, 2020 median household income of $123,294 and a median house value of $1,424,200, the rooftop retrofit market is a minority slice of housing, thinner per capita than inland SCE cities.
For the owner households that do exist, the profile is strong: Oracle, Stanford Hospital and Clinics, and the County of San Mateo anchor the employment base, and incomes at this level support cash and loan purchases without lease dependency. What we have seen in markets like this is a different failure mode: not affordability, but overbuying. A $40,000 system sold to a two person household with a modest daytime load exports most of its value at avoided cost rates. Size to the bill, not to the budget.
The 2026 incentive picture, without the wishful thinking
The federal 25D homeowner credit is gone for new completions. P.L. 119-21 terminated the 30 percent credit for expenditures made after December 31, 2025, and the statute treats an expenditure as made when installation is completed, per Congressional Research Service note IN12611. A purchase completed in 2026 has no 25D credit. Carryforward rules for pre 2026 expenditures are unchanged, which matters only if your system was finished last year.
What still exists is targeted. The SGIP Residential Solar and Storage Equity budget of $280 million opened reservations June 2, 2025 for low income residential customers, at $3,100 per kW for solar and $1,100 per kWh for storage, per the CPUC SGIP page. The Board of Equalization's new construction exclusion keeps a qualifying system from raising your assessed value, though it is scheduled to sunset January 1, 2027. And Civil Code 714 voids HOA restrictions that add more than $1,000 of cost or cut output more than 10 percent, with a 45 day deemed approval clock. We found no Redwood City specific rebate this session.
Bidding this market: four map results, so widen the net
Our Google Maps pull for Redwood City surfaced four companies, and two of them carry only a handful of reviews. That says less about contractor quality than about how Peninsula installers cluster in neighboring cities. Treat this list as a starting bench, add bids from the broader mid Peninsula, and make every bidder walk you through their SolarAPP+ submission history in this specific jurisdiction.

GBN Solar Panels In Woodside
Woodside, CA
5.0(1 Google reviews)

RM Energy
Woodside, CA
5.0(10 Google reviews)


Ratings snapshot: Google Maps, August 2026, via the DataForSEO SERP feed. Zero companies paid us and none are endorsed by us.
One Peninsula specific question separates serious bidders: how does your production model treat the marine layer? An installer quoting Central Valley capacity factors for a Redwood City roof is either careless or optimistic on purpose. Neither improves your true up.
Run the screening math for your own roof
This estimator uses the state average retail rate and our local production run. It does not simulate PG&E hourly export values, WestLight credits or fog microclimates. Use it to compare sizes and payment paths, then demand the detailed model from whoever wants your signature.
The slider top is our downtown Redwood City PVGIS run at 30 degree tilt. The bottom is 85 percent of that, a sensitivity cushion for marine layer exposure and imperfect roof planes, not a shading study.
Cash quotes in Redwood City cluster near $2.46 per watt, against a $3.50 national 2024 median (LBNL). Use your quote.
Assumptions you can change
Use the rate on your actual lease or PPA quote. There is no published statewide average we trust enough to hardcode.
Cash purchase
$8,364 after state credit
- Year 1 benefit
- $160/mo
- Payback
- 5 years
- 20 year net position
- $38,170
This calculator applies the California average retail rate as a stand in for value per kWh. A Redwood City account actually stacks PG&E delivery on Peninsula Clean Energy generation, and exports are credited under the Solar Billing Plan rather than netted. Use the output for sizing conversations, not billing predictions.
Solar loan
$112/mo 15 yr payment
- Year 1 net
- $48/mo
- Upfront
- $0
- 20 year net position
- $26,401
The loan figure carries the state calculator's documented loan-over-cash spread. Before financing a Redwood City project, get the cash price, the financed price, any dealer fee and the prepayment terms written as separate line items.
Lease / PPA
$0 down you buy the power
- Year 1 net
- $44/mo
- Upfront
- $0
- 20 year net position
- $14,560
The federal 25D homeowner credit ended for systems completed after December 31, 2025, and the CRS note we rely on does not address third party ownership, so we make no claim about what a lease or PPA provider collects. Judge any lease on its rate, escalator and buyout schedule against your real PG&E and Peninsula Clean Energy bill.
Estimates, not quotes. This tool combines the California average retail rate, our downtown Redwood City PVGIS run and statewide cost inputs. It cannot model hourly export credits, Peninsula Clean Energy premiums, fog patterns on your specific street or fixed charges. We are a solar installer and we also partner with other solar companies. See our disclosures.
We are a solar installer and we also partner with other solar companies.
Redwood City questions we actually get
Is Peninsula Clean Energy the same thing as WestLight Energy?
How fast is a Redwood City solar permit?
What is the export premium people mention?
Can I have solar and 100 percent renewable ECO100 service?
What does the city permit cost?
Is there still a federal tax credit in 2026?
Paper trail
Every claim above traces to these documents, reviewed for this page on August 28, 2026.
- Redwood City SolarAPP+ Automatic Permitting, Building Inspection contact page, E-TRAKiT portal, and Master Fee Schedule page
- Peninsula Clean Energy background, agency home page, rate choices, Solar Billing Plan, and legacy NEM solar rates
- CPUC Net Billing Tariff page and Resolution E-5301 materials
- EIA Table 6 utility rates, CPUC SGIP, CRS IN12611, and BOE active solar exclusion
- Government Code 65850.52, Government Code 66015, Civil Code 714, and the CEC permitting program data file
- DOF E-5 housing estimates, Redwood City Wikipedia entry, PVGIS, and our 20 degree tilt verification run
Get a Redwood City estimate anchored to your bill
Answer four short questions and get an estimate built from this page's local inputs, not a national template.
What does your monthly electric bill look like?
Redwood City average is $161 per month (EIA, 2024).