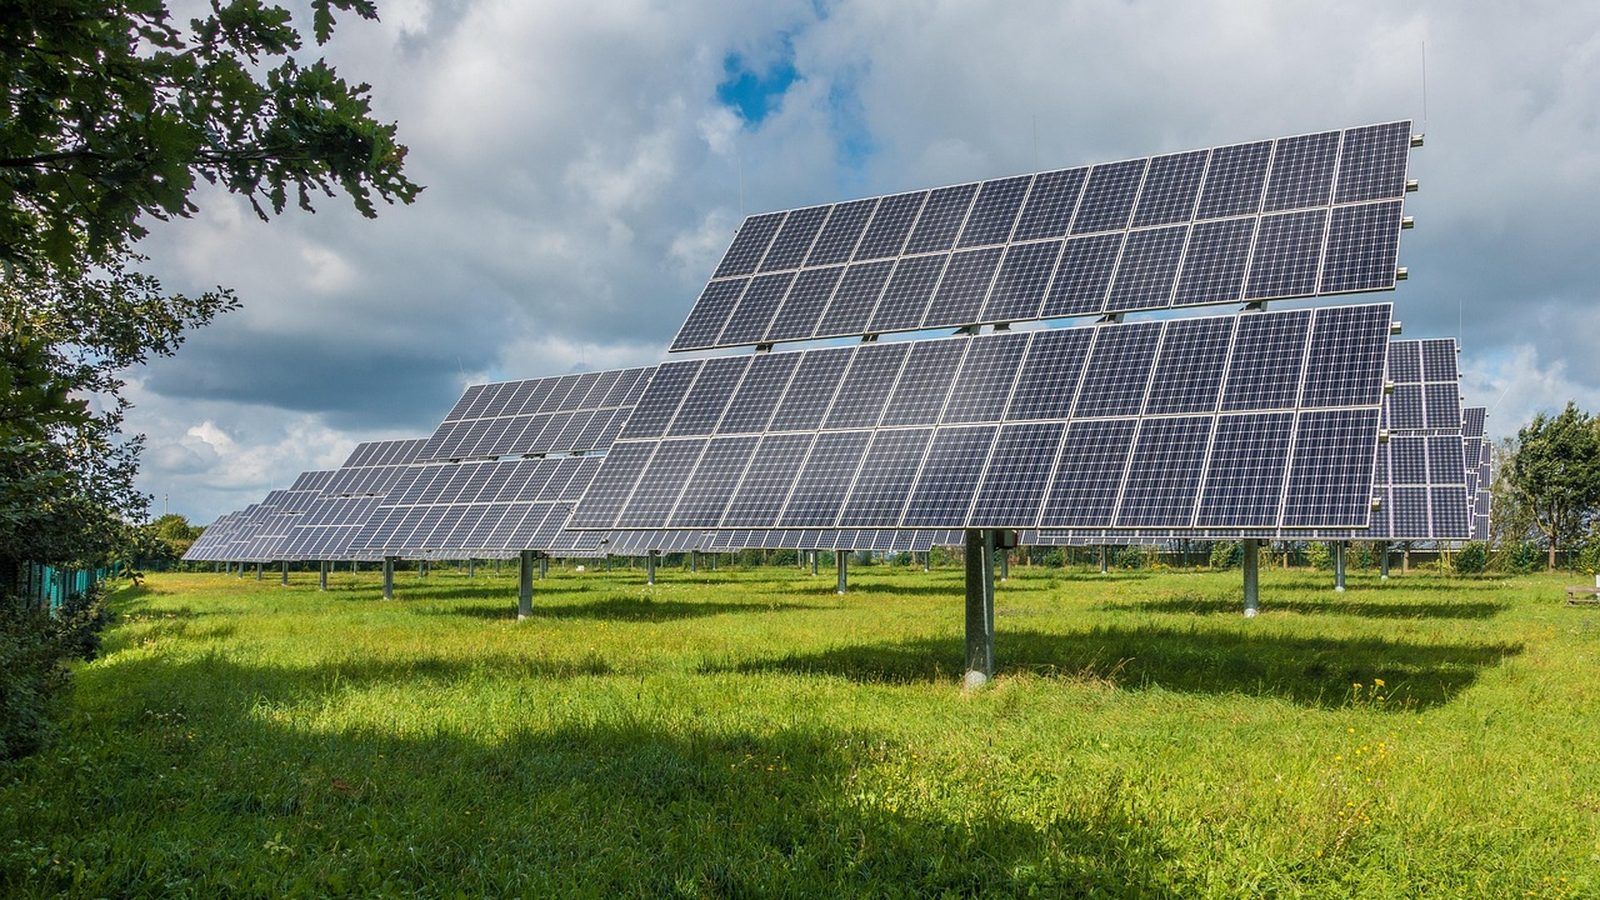
Photo: mrganso, via Pixabay
California · Richmond
Richmond solar runs through MCE, and the clock is running
Written by the Solar Learning Lab research deskUpdated August 25, 202610 min read
Most Richmond households have not bought their electricity generation from PG&E in over a decade. The city partnered with MCE in 2013, and per the City's own page roughly 81.9 percent of the population was enrolled as of MCE's 2021 participation data. Go solar here and you do not enter a simple PG&E relationship. You enter a two-party billing arrangement with rules that most sales decks flatten into mush.
Two of those rules deserve top billing. Enrolling in MCE's Solar Billing Plan moves your account onto PG&E's E-ELEC rate whether you asked for it or not. And MCE's Energy Export Bonus Credit is stepping down every install year, from $0.018 per kWh for 2024 systems to $0.009 for 2026 and $0.004 for 2027. Neither fact appears in most quotes we see. Both belong in yours.
Check the export math first
Before comparing panel brands, understand what a Richmond export actually earns and what E-ELEC does to your import side.
See the billing realityTwo companies, one bill, since 2013
The division of labor is clean once you see it. PG&E owns the wires, delivers the power, reads the meter and sends the bill. MCE supplies the generation as Richmond's default provider, serving roughly 36,000 customers in the city as part of its 38-community footprint. The City's MCE page notes that every City of Richmond municipal account is on MCE too, and that the City has put solar on 450 Civic Center Plaza, the Public Library and the Memorial Auditorium.
MCE's product tiers matter less for solar sizing than people think, but for the record: Light Green is the 60 percent renewable default, Deep Green is 100 percent renewable for a penny more per kWh, and Local Sol is 100 percent local solar at $0.142 per kWh, capped at about 300 customers. What matters more is that this two-company structure gives solar customers two settlement processes. MCE runs its own April through March cash-out, separate from the PG&E true-up. Homeowners reading one bill and expecting one annual reckoning routinely get confused by this. It is not you. It is the structure.
The Solar Billing Plan picks your rate plan for you
Here is the sentence that should be printed on every Richmond proposal: all MCE Solar Billing Plan customers are moved onto PG&E's E-ELEC rate. Not offered. Moved. MCE's Solar Billing Plan page says so, and the plan applies to anyone who received permission to operate after April 14, 2023, plus legacy customers whose 20-year NEM period has run out.
E-ELEC is not a punishment, but it is a different animal. Per PG&E's March 1, 2026 pricing, it runs 33, 39 and 55 cents per kWh across summer periods and 28, 30 and 32 cents in winter, and it carries a Base Services Charge that does not go away in a high-export month. Your post-solar bill has a fixed floor. Model it that way.
| Energy source | Type | Average price | What that means |
|---|---|---|---|
| PG&E E-ELEC | the rate the SBP assigns | 28¢ to 55¢ per kWh | Plus a Base Services Charge that persists regardless of exports. |
| MCE export credit | Energy Export Credit Value | wholesale-based per exported kWh | Credited monthly; not retail; annual cycle runs April through March. |
| MCE Solar Bonus Credit | on top of export credits | 10% of Energy Export Credits | MCE's standing add-on for Solar Billing Plan customers. |
| Self-consumed solar | avoided E-ELEC purchase | up to 55¢ per kWh at summer peak | The strongest dollar in the whole Richmond stack is the purchase you never make. |
MCE Solar Billing Plan and PG&E residential pricing. Structural snapshot, not a bill simulation.
Cash-out mechanics, briefly: annual net surplus pays at the net surplus compensation rate, checks issue above $200, and the payout caps at $5,000 per account. Legacy NEM customers have their own settlement quirks, including a $0.02 per kWh adder on surplus and an extra penny for Deep Green, covered on MCE's NEM page. The statewide Net Billing Tariff framework behind all of this is CPUC Decision D.22-12-056; see the CPUC page or our California overview.
The bonus credit is on a countdown
MCE publishes its Energy Export Bonus Credit by installation year, and the table only goes one direction. Standard residential: $0.018 per kWh for 2024 installs, $0.013 for 2025, $0.009 for 2026, $0.004 for 2027. Low-income customers: $0.072, then $0.054, then $0.036, then $0.018 across the same years. The schedule is public, which makes this a rare honest urgency argument. A system energized this year locks a better export adder than the same system energized next year. No overstatement required; the table does the talking.
Stack the rest of the MCE layer while you are at it. CARE and FERA customers get a $0.05 per kWh Solar Credit. Storage earns $10 per month under 20 kWh or $20 per month at 20 kWh and above. These are ongoing bill credits, not upfront rebates, so they shift payback timing rather than shrinking the invoice. An installer who quotes Richmond without mentioning any of them has not done Richmond homework.
The permit fee sits exactly at the state's ceiling
Richmond's master fee schedule lists the residential solar structure permit at $450.00, which is precisely the maximum Government Code 66015 allows for systems up to 15 kW without special findings. Not a dollar under. For contrast, Antioch charges $316.00 for the equivalent permit. Same statute, same county, a very different invoice line. The FY 2026-27 schedule is the controlling document.
The same schedule carries a warning worth reading twice. Work performed without a permit triggers an investigation fee of 3 times the permit fee, plus a Code Compliance Permit and Inspection fee listed at $613.00 rising to $638.00. A contractor who suggests skipping the paperwork on a small system is proposing that you absorb that risk. Decline.
Two lanes into one portal called iMS
Richmond kept both of its streamlined paths alive, which is genuinely useful. Lane one is SolarAPP+: automated code review and instant permit creation for residential retrofit rooftop PV that conforms to the eligibility checklist, described on the City's installer page, which also specifies an attachment naming convention for uploads. The CEC's tracking workbook shows Richmond operating a SolarAPP+ Platform, funded in part by an $80,000 CalAPP grant awarded April 2023, per the state mandate in Government Code 65850.52.
Lane two is older: the AB 2188 expedited path Richmond adopted by Ordinance 22-15 N.S. back in September 2015, with a published eligibility checklist and standard plans on the Residential Solar Systems page. Its limits are specific. Systems must be 10 kW AC or less, roof-mounted on a one- or two-family dwelling, and utility interactive without battery storage. Add a battery and this lane closes; the project needs SolarAPP+ eligibility or a standard plan check. Note the size gap too: the local checklist stops at 10 kW while the state automated-platform mandate reaches 38.4 kW.
Everything files through iMS, the portal that replaced eTRAKiT. Older how-to guides pointing at eTRAKiT are dead ends now. Applications, inspections and payments all live in iMS, and the Building Division answers at (510) 620-6868, with inspections scheduled at 510-447-1156.
Cool-coast production: lower peak, useful floor
Our downtown Richmond PVGIS run lands at 1,569.4 kWh per year per installed kW. May is the top month at 161.5 kWh per kW, December the bottom at 82.4. That annual figure trails inland Antioch, and the shape is flatter, which fits a bayside city where average highs peak near 73 F in September and air conditioning barely registers as a load.
May models highest at 161.5 kWh per kW. With Richmond's mild summers, the case for solar rests on offsetting expensive delivered power, not on feeding an air conditioner.
PVGIS v5.2 model run by Solar Learning Lab on August 25, 2026, NSRDB radiation database. Fixed south facing mount, 30 degree tilt, 14 percent losses, downtown Richmond coordinates. Your roof will differ. Model via PVGIS. One structural note from the housing data: only 55.4 percent of Richmond's 41,117 units are single detached homes, and 38.0 percent of the stock sits in buildings of two or more units, per the state's 2026 estimates. The addressable rooftop market here is narrower than East County's, and wind of 6 to 9 mph off the bay is a racking design input, not an afterthought.
What help remains after the federal exit
The 25D homeowner credit ended for expenditures after December 31, 2025, and completion of installation is the date that controls. A Richmond system finished in 2026 gets nothing from 25D even if the contract was signed in 2024. CRS IN12611 is the citation to hand any salesperson who claims otherwise.
Still live: SGIP's Residential Solar and Storage Equity budget at $3,100 per kW of solar and $1,100 per kWh of storage for low-income residential customers, with $280 million authorized and reservations open since June 2, 2025, one-year completion window, demand response enrollment required. CPUC SGIP page. DAC-SASH runs through 2030 for CARE or FERA households in top-quartile CalEnviroScreen tracts via GRID Alternatives; Richmond contains tracts widely associated with environmental burden, but eligibility is checked per address, not per city. We found no City-run rebate. The MCE credits described above are the local sweetener, and they arrive as bill credits over time, not as cash at signing.
The Richmond bid list leans on Concord and Berkeley
Several of the strongest-rated companies serving Richmond are based in Concord or Berkeley. Fine. What to demand from each: proof the design clears either the SolarAPP+ checklist or the 10 kW expedited checklist, a written statement of who claims which MCE credits, and an E-ELEC-based bill projection rather than a generic PG&E one.
SunPower®
Richmond, CA
4.4(477 Google reviews)
solarXperts
Concord, CA
4.3(102 Google reviews)
Ratings snapshot: Google Maps, August 2026, via the DataForSEO SERP feed. Zero companies paid us and none are endorsed by us.
Work the worksheet, then argue with it
This estimator cannot see MCE's wholesale-based export values or the E-ELEC fixed charge, and it does not pretend to. What it does well is compare system sizes and payment structures on consistent assumptions. Get your range here, then make every bidder explain any number that lands outside it.
1,569 kWh per installed kW is our Richmond PVGIS result and the top of this slider. The bottom is 85 percent of that, a sanity margin for fog exposure and imperfect roof planes.
Cash quotes in Richmond cluster near $2.46 per watt, against a $3.50 national 2024 median (LBNL). Use your quote.
Assumptions you can change
Use the rate on your actual lease or PPA quote. There is no published statewide average we trust enough to hardcode.
Cash purchase
$9,102 after state credit
- Year 1 benefit
- $161/mo
- Payback
- 5 years
- 20 year net position
- $37,752
A Richmond account has two halves: PG&E delivery and MCE generation. Solar exports run through MCE's Solar Billing Plan with its own bonus credits and an April to March cash-out cycle, none of which this screening tool can reproduce. Use the output to compare sizes, not to predict a true-up.
Solar loan
$122/mo 15 yr payment
- Year 1 net
- $39/mo
- Upfront
- $0
- 20 year net position
- $24,944
Before financing a Richmond system, get the cash price and the financed price on paper side by side. The gap between them is the dealer fee, whatever the paperwork calls it.
Lease / PPA
$0 down you buy the power
- Year 1 net
- $45/mo
- Upfront
- $0
- 20 year net position
- $14,660
With a lease or PPA in Richmond, the provider owns the equipment and the export credits flow per the contract, not per your assumption. Read who receives the MCE credits before signing, and compare the contract rate against your combined PG&E and MCE bill.
Estimates, not quotes. Inputs are the California average retail rate, our downtown Richmond PVGIS run and statewide cost data. The tool does not model MCE export credits, the E-ELEC Base Services Charge or marine-layer shading effects. We are a solar installer and we also partner with other solar companies. See our disclosures.
We are a solar installer and we also partner with other solar companies.
Asked in Richmond
Do I choose between PG&E and MCE when I go solar?
How much is Richmond's solar permit?
Why do people say to install sooner rather than later here?
Can a solar-plus-battery project use the expedited checklist?
What happens if work was done without a permit?
Is there still a federal tax credit for a 2026 Richmond install?
Records behind this page
City fee schedules, MCE program pages, state statutes and tariff documents cited above, all reviewed August 25, 2026.
residentialSolar · solarAppInstallers · eligibilityChecklist · buildingDivision · imsPortal · masterFees · cityMce · ordinances · feeCap · sb379 · cecTracker · mceArea · mceSbp · mceNem · pgeRates · pgeTerritory · cpucNbt · sgip · dacSash · federal · climate · housing
Get a Richmond proposal that names the MCE credits
Bring your usage and your roof. Leave with questions that separate prepared bidders from template sellers.
What does your monthly electric bill look like?
Richmond average is $167 per month (EIA, 2024).