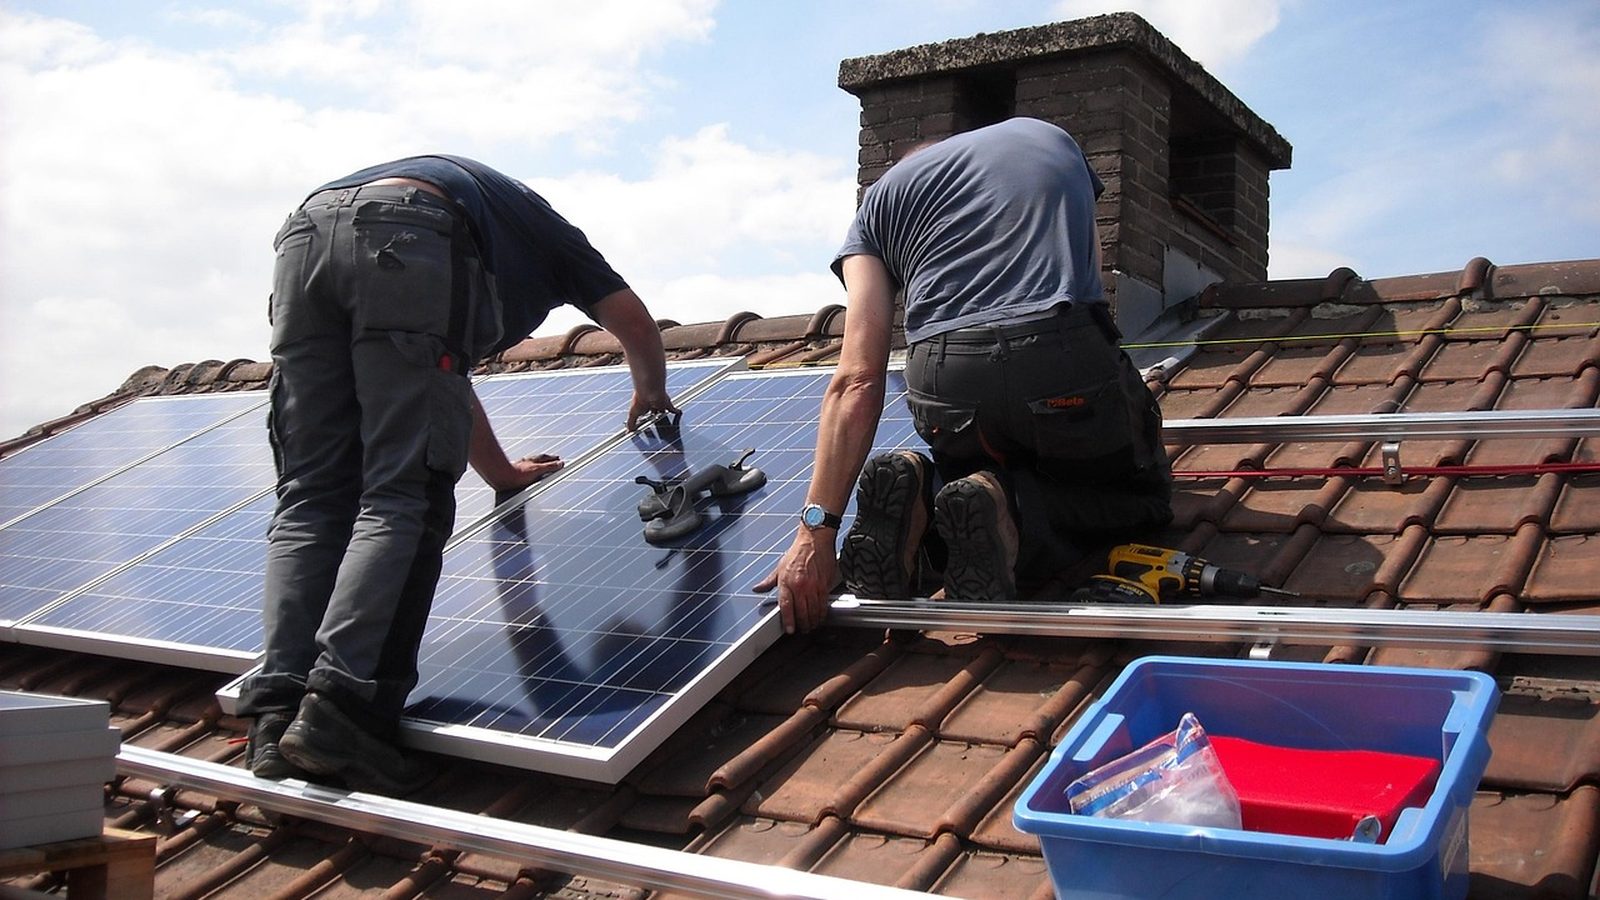
Photo: MariaGodfrida, via Pixabay
California · Santa Maria
Santa Maria solar: where the CCA costs more, not less
Written by the Solar Learning Lab research deskUpdated August 25, 202610 min read
Community choice aggregators usually get marketed as the cheaper option. Santa Maria breaks the script. The current joint comparison published by PG&E puts the total E-1 rate for a 3CE customer at $0.45701 per kWh against $0.42082 for bundled PG&E service. Higher, not lower. If you are running solar payback numbers here, that document is where the honest math starts.
The city holds a second surprise, and this one is pleasant. Santa Maria's own municipal code obligates the Community Development Department to issue a nondiscretionary building permit for a qualifying rooftop system within three business days of a complete application. Not a goal. A code section. This page walks through both facts, plus the one number the city does not publish.
Know your real per-kWh cost
Payback depends on the rate you actually pay, and in Santa Maria that rate has a surcharge line most quotes skip. Check the comparison before checking panel specs.
Start with the ratesThe joint rate sheet says the quiet part in numbers
Santa Maria has taken generation service from Central Coast Community Energy since January 2021, when it joined ten other San Luis Obispo and Santa Barbara county communities in the 3CE transition. PG&E still delivers, meters and bills, with 3CE appearing as a generation line item. Standard CCA structure. The economics are not standard.
The joint PG&E and 3CE comparison, with PG&E rates as of March 1, 2026 and 3CE rates as of February 15, 2026, breaks the E-1 residential rate into parts. 3CE's generation charge is actually cheaper: $0.11725 against PG&E's $0.12762. Delivery is identical at $0.30238. The swing is the PCIA and franchise fee surcharge, which subtracts $0.00918 for a bundled PG&E customer and adds $0.03738 for a 3CE customer. Total it up and 3CE service costs $0.45701 per kWh versus $0.42082, or $168.97 versus $155.59 on the comparison's 370 kWh sample month.
| Energy source | Type | Average price | What that means |
|---|---|---|---|
| PG&E bundled E-1 | total effective rate | $0.42082 per kWh | Generation $0.12762, delivery $0.30238, surcharge line minus $0.00918. |
| 3CE E-1 (3Cchoice) | total effective rate | $0.45701 per kWh | Cheaper generation at $0.11725, but the PCIA and franchise surcharge adds $0.03738. |
| Sample month at 370 kWh | average bill comparison | $155.59 vs $168.97 PG&E vs 3CE | From the same joint comparison document. |
| Solar consumed onsite | avoided purchase | up to the full delivered rate per kWh | The higher your delivered cost, the more each self-consumed solar kWh is worth. The 3CE premium cuts both ways. |
Joint PG&E and 3CE rate comparison. Rates change; pull the current sheet before deciding anything.
Two takeaways an operator would underline. First, never let anyone tell you 3CE is automatically cheaper; on this schedule it is not, and the same pattern shows on other schedules where 3CE generation is lower but the surcharge flips the total. Second, an expensive delivered kWh is exactly the kWh solar is best at replacing. The premium that stings on the bill strengthens the case for panels.
Three business days is written into the code
Chapter 9-52 of the Santa Maria Municipal Code, adopted by Ordinance 2019-10 and effective January 1, 2020, implements the state's solar streamlining laws with unusual precision. For a small residential rooftop system, the Community Development Department must issue a nondiscretionary building permit within three business days of receiving a complete application that meets the approved checklist and standard plan. Incomplete submittals get a written correction notice naming what needs fixing.
The definition doing the gatekeeping: no larger than 10 kW AC or 30 kWth thermal, mounted on a single-family or duplex dwelling, code-conforming, and under the maximum legal building height. The chapter also blocks two classic delay vectors. A use permit can only be required on written substantial evidence of a specific adverse impact to public health or safety, and permit approval cannot be conditioned on a homeowners association signing off. Mobile homes are the notable exclusion; the streamlined definition covers single-family and duplex dwellings, and Santa Maria has 1,451 mobile home units in its stock of 32,737 per the state housing table.
Applications move through eTRAKiT, the City's online permit system, which handles submittals, inspection requests and payments. Photovoltaic work is its own permit application, separate from grading or general building permits on larger projects. The City's process page and Building Division contacts cover the mechanics; the counter sits at 110 S. Pine St., Room 101, and permit technicians answer at (805) 925-0951 extension 2241.
The permit fee is the number nobody publishes
We looked for a Santa Maria residential solar permit fee on the permit processing page, the inspections page, the permits and licenses page, the codified fee schedule documents and the City's 2024 user fee study. None of them states a solar or photovoltaic fee amount. So we will not invent one, and neither should your installer.
What can be said with confidence: Government Code 66015 caps residential PV permit fees statewide at $450 for systems up to 15 kW, plus $15 per kW above that, unless a city adopts findings and a resolution supported by substantial evidence. That ceiling bounds whatever Santa Maria charges. Get the actual figure from the Building Division at (805) 925-0951 ext. 2241 before signing, and require the receipt in your project file. A contractor who resists itemizing a government fee is telling you something about the rest of the quote.
The SolarAPP+ record has a hole in it
Here is a discrepancy we refuse to paper over. The CEC's statewide tracking workbook, updated August 3, 2026, lists Santa Maria under a SolarAPP+ Platform designation and records an $80,000 CalAPP grant dated February 2023, under the mandate in Government Code 65850.52. Yet no City page we reviewed mentions SolarAPP+ at all, the City directs applicants to eTRAKiT and a standalone photovoltaic permit application, and Santa Maria is absent from NREL's availability table. The workbook also shows no annual report submitted for Santa Maria, where Antioch and Richmond show 2024 data.
We are not accusing anyone of anything; the CEC itself disclaims certifying compliance. The practical read: do not plan around instant automated permitting here until the Building Division confirms it directly. Plan around the three-business-day commitment in SMMC 9-52 instead. That one is enforceable local law with a paper trail.
Fog in the mornings, 1,773 kWh by year end
Santa Maria's marine-layer reputation undersells its solar resource. Our downtown PVGIS run totals 1,773.5 kWh per installed kW per year, the strongest of the three cities we modeled in this batch, ahead of inland Antioch. The shape is the interesting part: May leads at 174.2 kWh per kW, and December still delivers 111.7, a winter floor far above what East Bay roofs manage. Consistent Central Coast sun, mild seasonality.
May models at 174.2 kWh per kW, but note the December floor of 111.7. Santa Maria's flat production curve means winter bills get real help, unusual for California.
PVGIS v5.2 model run by Solar Learning Lab on August 25, 2026, NSRDB radiation database. Fixed south facing mount, 30 degree tilt, 14 percent losses, downtown Santa Maria coordinates. Your roof will differ. Run with the PVGIS tool. The local climate normals explain the shape: a cool-summer Mediterranean pattern with a 69.6 F annual mean daily maximum, common morning fog that pushes useful generation later into the day, and almost no air conditioning season. Payback here rests on the high delivered cost per kWh, not on cooling load. Household size helps too: at 3.55 persons per household, Santa Maria homes carry more baseline consumption than the state pattern suggests.
Exports run through 3CE's Solar Billing Plan
New interconnections have operated under Solar Billing Plan rules since April 15, 2023. The 3CE Policy Board adopted its plan in February 2024, residential enrollment launched in June 2024, and commercial enrollment follows in 2026. Exports earn an Energy Export Credit priced from hourly values derived from the CPUC's Avoided Cost Calculator, not from retail rates. Anyone on NEM 1.0 or 2.0 keeps those terms through their 20-year grandfathering window. 3CE's plan page carries the details, and the CPUC documents the statewide framework, which our California page explains in full.
One modest local adder exists: CARE and FERA customers receive a flat $0.00396 per kWh on exports for nine years, rolling over monthly and settling at true-up. Call it what it is, a small long-tail credit, useful but nowhere near a headline incentive. Design conclusion for Santa Maria: with export values wholesale-based and delivered rates high, self-consumption carries the project. Size for the household, not for the export meter.
Assistance worth checking before you sign
The federal 25D homeowner credit is gone for installations completed after December 31, 2025; completion date controls regardless of when the contract was signed. CRS IN12611. A 2026 Santa Maria purchase gets no federal homeowner credit, and any quote showing one needs to be corrected before you read another line of it.
Two programs remain worth a look for qualifying households. SGIP's Residential Solar and Storage Equity budget pays $3,100 per kW on the solar side and $1,100 per kWh on the storage side to low-income residential customers, $280 million authorized, reservations open since June 2, 2025, with a one-year window to meet requirements including demand response enrollment. CPUC SGIP page. And DAC-SASH, running through 2030 via GRID Alternatives, serves CARE or FERA households in top-quartile CalEnviroScreen tracts; eligibility is tract-by-tract, so verify the address. We found no Santa Maria city rebate and no 3CE upfront rebate program in the material reviewed.
The crews serving Santa Maria are small. Vet accordingly.
The local map results skew toward small operations, several based in Santa Maria itself or up the road in Arroyo Grande, with modest review counts. That is not disqualifying, but it changes your diligence. Confirm the CSLB license, ask for a recent local job you can drive past, and require the bid to state whether the design fits the SMMC 9-52 checklist and standard plan, because that is what unlocks the three-day permit.
Original Energy Co
Arroyo Grande, CA
5.0(37 Google reviews)
Planet Oath LLC
Santa Maria, CA
4.4(34 Google reviews)
Nostalgic's Inc /Alternative energy solutions
Santa Maria, CA
4.6(26 Google reviews)
Planet Oath Energy Inc
4.8(20 Google reviews)
American Solar Company
4.8(16 Google reviews)
Tesla Home Energy and Solar - Central Coast
Santa Maria, CA
4.6(8 Google reviews)
Ratings snapshot: Google Maps, August 2026, via the DataForSEO SERP feed. Zero companies paid us and none are endorsed by us.
Model a Santa Maria system, then stress it
The estimator uses our local production run against statewide rate and cost inputs. It cannot see the 3CE surcharge line or hourly export values, so use it for what it is good at: comparing sizes and payment paths on equal footing. Then ask each bidder to justify their deviation from it.
Top of the slider: 1,774 kWh per installed kW from our Santa Maria PVGIS run, the strongest result of the three cities we modeled in this batch. Bottom: 85 percent of it, allowing for fog-side roofs and imperfect orientation.
Cash quotes in Santa Maria cluster near $2.46 per watt, against a $3.50 national 2024 median (LBNL). Use your quote.
Assumptions you can change
Use the rate on your actual lease or PPA quote. There is no published statewide average we trust enough to hardcode.
Cash purchase
$8,118 after state credit
- Year 1 benefit
- $162/mo
- Payback
- 5 years
- 20 year net position
- $39,105
Santa Maria bills arrive from PG&E with a 3CE generation line item, and the joint rate comparison shows the 3CE total E-1 rate above PG&E bundled at present. This tool uses a single statewide rate, so treat it as a size-comparison instrument rather than a bill predictor.
Solar loan
$109/mo 15 yr payment
- Year 1 net
- $54/mo
- Upfront
- $0
- 20 year net position
- $27,682
On a financed Santa Maria quote, insist on seeing the cash price next to the financed price. The difference is the cost of the money, and it belongs in your payback math, not buried in a monthly payment.
Lease / PPA
$0 down you buy the power
- Year 1 net
- $45/mo
- Upfront
- $0
- 20 year net position
- $14,775
A lease or PPA here means the provider owns the array and the interconnection sits under the 3CE Solar Billing Plan per the contract terms. Compare the offered rate and escalator against your real delivered cost per kWh, which the joint PG&E and 3CE comparison puts higher than most people guess.
Estimates, not quotes. This tool blends the California average retail rate, our downtown Santa Maria PVGIS run and statewide cost inputs. It cannot model 3CE export credit values, marine fog timing or the PCIA surcharge line. We are a solar installer and we also partner with other solar companies. See our disclosures.
We are a solar installer and we also partner with other solar companies.
Santa Maria solar, asked and answered
Is 3CE cheaper than PG&E in Santa Maria right now?
How fast does Santa Maria issue a residential solar permit?
What is the city's solar permit fee?
Does Santa Maria offer instant SolarAPP+ permitting?
Can my HOA block the permit?
Do mobile homes qualify for the streamlined path?
Source ledger
The rate comparison, code chapter, state statutes and program pages behind this article, each reviewed August 25, 2026.
permitProcessing · inspections · postEntitlements · permitsLicenses · smmc952 · feeCap · sb379 · cecTracker · solarAppMap · rateComparison · pgeRates · pgeTerritory · threeCeHow · threeCeSbp · threeCeLaunch · cpucNbt · sgip · dacSash · federal · climate · housing
Get a Santa Maria estimate built on the real rate
Your delivered cost per kWh is higher than the brochure number. Start there and the rest of the decision gets clearer.
What does your monthly electric bill look like?
Santa Maria average is $167 per month (EIA, 2024).