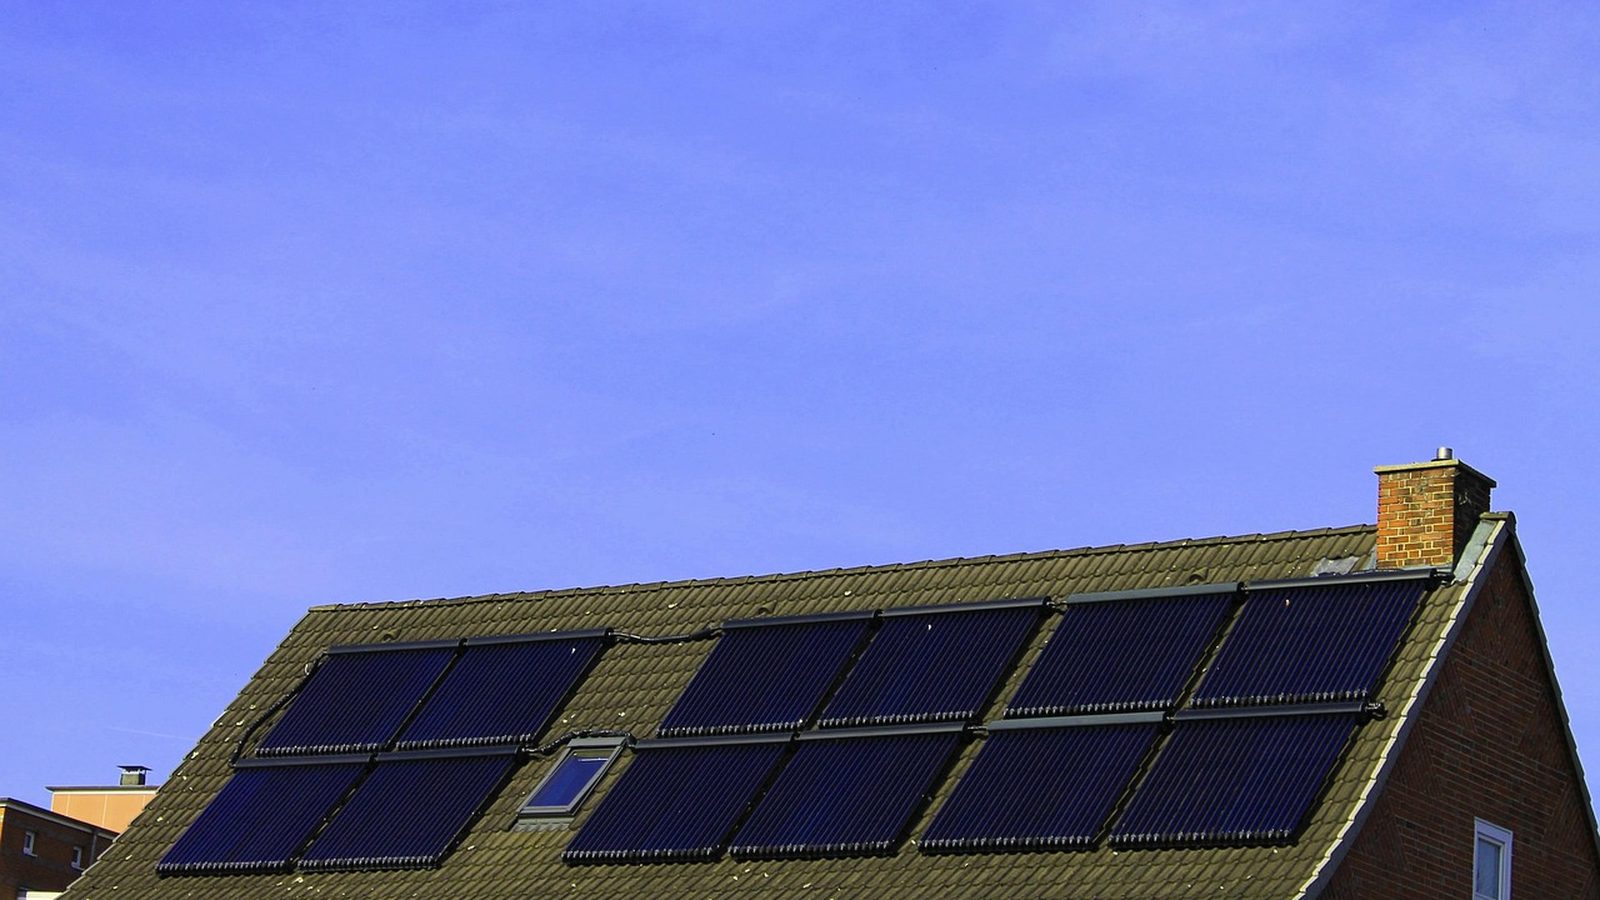
Photo: kalhh, via Pixabay
California · Victorville
Solar in Victorville: high output does not make the decision easy
Written by the Solar Learning Lab research deskUpdated August 24, 2026
Victorville is the production king of this five-city run. Our standardized PVGIS model lands at 1,917.4 kWh per installed kW per year, the kind of High Desert number that gets sales teams talking fast. It deserves attention. It does not erase the rest of the job.
The actual setup is plainer than the pitch: Southern California Edison territory, no community choice aggregator in Victorville proper, SolarAPP+ available, and a published $372 permit fee before additional listed charges. The good news is strong sunlight. The work is matching it to household use, tariff timing and a fully scoped contract.
Stress-test a strong production claim
Run the local output through a cautious estimate before an annual kWh figure gets mistaken for cash savings.
Estimate Victorville solarVictorville wins this run on modeled production
The downtown Victorville PVGIS run produces 1,917.4 kWh annually per kW, with May at 182.7 kWh per kW and December still at 129.9. The research describes the local climate as cold desert and records 109 average days a year at 90°F or higher. That tells you why the resource is strong. It does not tell you the shade, orientation or cooling schedule at a specific house. The cited climate summary provides the regional context.
May is the model peak at 182.7 kWh per kW. High production becomes valuable when it serves real load instead of low-value exports.
PVGIS v5.2 model run by Solar Learning Lab on August 24, 2026, using the NSRDB radiation database. Fixed south-facing mount, 30 degree tilt, 14 percent losses, downtown Victorville coordinates. Your roof will differ. This result uses PVGIS. A useful bid should say how much of that modeled output is expected to be self-consumed, not merely announce annual production and call the system offset.
Victorville is SCE territory, not Apple Valley territory
SCE lists Victorville in its service-area materials. Apple Valley Choice Energy is nearby, but it does not cross the town line: its FAQ says customers need a service address inside the Town of Apple Valley. Victorville homeowners should not assume a CCA generation option from a neighboring jurisdiction. SCE's service-area fact sheet and AVCE's own boundary language settle that point.
| Energy source | Type | Average price | What that means |
|---|---|---|---|
| SCE | 2024 average residential price | 32.4¢ per kWh | EIA-861 bundled residential average, not a quote for a household. |
| SCE TOU-D-4-9PM | summer weekday peak | 58¢ per kWh | Published June through September 4 to 9 p.m. energy price. |
| SCE TOU-D-5-8PM | summer weekday peak | 74¢ per kWh | Published June through September 5 to 8 p.m. energy price. |
| New solar exports | Net Billing value | hourly avoided-cost credit | Export compensation is not the SCE retail rate. |
For new interconnections, the CPUC's Net Billing Tariff is the framework. It uses hourly avoided-cost values for exports; SCE residential customers receive a standard ACC Plus adder of 4 cents per kWh under the adopted materials. That is why an unqualified “full offset” claim needs a bill model behind it. CPUC tariff overview and the adopted ACC materials explain the moving parts.
The permit is published. The all-in government cost still needs a line item.
Victorville's January 8, 2026 Stand Alone Permits Fee Calculation Chart lists $372 for residential PV up to 15 kW. The City notes that a 4.6% technology fee plus seismic and green fees are added on top. SolarAPP+ submittals also carry an additional SolarAPP+ processing fee. The right question is not “what is the permit fee?” in isolation. It is “show every City and platform charge for this scope.” Fee chart and City solar page.
The $372 published base fee is below the $450 threshold stated in Government Code 66015 for a system up to 15 kW. The City directs SolarAPP+ users to register and submit through the platform, while its Citizen Self Service Portal covers applications, uploads, payment, review status and inspections. Standard review has no published turnaround commitment in the supplied City pages.
Inspection windows are another practical item: 8 a.m. to noon or 1 p.m. to 5 p.m. Monday through Friday, with Friday afternoon ending at 4 p.m. Ask who will be present and what happens if the inspector calls a correction. A fast permit does not prevent an installation-day miss. Victorville's solar instructions list the windows.
There are many roofs here. That is not the same as easy projects.
Victorville's state housing estimate counts 33,652 single-detached homes out of 41,563 total units, 81.0%. It is the highest detached-home share in this group of five cities. The same table reports 3.42 persons per household, also the batch high. Those are reasons to take rooftop solar seriously, not permission to skip load analysis. The Department of Finance table has the underlying counts.
High Desert households can have a meaningful cooling load. But one family may be home through the afternoon while another does most of its demand after the solar curve falls. Get interval data if available. If not, at least mark the months and hours where consumption actually climbs before sizing toward annual usage.
Program dollars are conditional, not a standard Victorville discount
No City-specific solar or battery rebate was identified in the supplied research. Statewide SGIP programs may matter for qualifying households: the Residential Solar and Storage Equity budget lists $3,100 per kW for solar and $1,100 per kWh for storage. A separate Small Residential Storage budget is described as available through 2025, so its live reservation status should be checked rather than assumed. CPUC SGIP details.
DAC-SASH is administered by GRID Alternatives for qualifying owner-occupied single-family homes in qualifying disadvantaged census tracts, with CARE or FERA income eligibility. That is a real screening route, but it is not a substitute for checking the address. Program eligibility.
The residential federal 25D credit no longer applies to expenditures after December 31, 2025. A clean 2026 quote should not show that reduction in the homeowner's net price. CRS guidance states the rule.
Compare designs, not just the High Desert headline
Give each contractor the same bill history and the same roof facts. Then ask for output, assumed self-consumption, SCE tariff assumption, permit charges, electrical upgrades and any excluded work. Production can be excellent in Victorville while the contract is still weak.
Socal Energy Group, Llc
Victorville, CA
4.9(288 Google reviews)
Nippon Energy
Victorville, CA
4.6(31 Google reviews)
Ratings snapshot: Google Maps, August 2026, via the DataForSEO SERP feed. Zero companies paid us and none are endorsed by us.
Run the sunny case, then lower it
The local model is the reason to test this market. The lower slider is the reason not to believe it blindly. Use the calculator to compare costs and system sizes, then require a project-specific design before making a final decision.
The upper result is the downtown Victorville PVGIS benchmark. The lower position is 85 percent of that number, which gives strong-sun claims somewhere honest to bend.
Cash quotes in Victorville cluster near $2.46 per watt, against a $3.50 national 2024 median (LBNL). Use your quote.
Assumptions you can change
Use the rate on your actual lease or PPA quote. There is no published statewide average we trust enough to hardcode.
Cash purchase
$7,380 after state credit
- Year 1 benefit
- $159/mo
- Payback
- 4 years
- 20 year net position
- $39,034
Victorville has an unusually strong modeled solar resource, but this calculator still uses a simplified retail-value assumption. It does not price SCE's hourly export credits or your interval load.
Solar loan
$99/mo 15 yr payment
- Year 1 net
- $61/mo
- Upfront
- $0
- 20 year net position
- $28,649
High production does not rescue an expensive financing contract. Compare total financed cost with cash cost, rate, term, dealer fee and the consequences of an early payoff.
Lease / PPA
$0 down you buy the power
- Year 1 net
- $44/mo
- Upfront
- $0
- 20 year net position
- $14,522
For a PPA or lease, compare the starting energy price and annual escalator against the SCE rate plan actually on the bill. Production alone is not the deal.
Estimates, not quotes. This tool uses the California average retail rate, a Victorville PVGIS production run and California market cost inputs. It cannot reproduce SCE hourly export credits, fixed charges or roof-specific shading. We are a solar installer and we also partner with other solar companies. See our disclosures.
Victorville solar questions
Does Victorville have unusually high solar production?
Can a Victorville resident use Apple Valley Choice Energy?
What is the City's listed solar permit fee?
What happens to exported solar power on SCE?
Is there a current City rebate?
Victorville source file
Key documents: City solar instructions, permit fee chart, SCE rates, CPUC Net Billing materials, SGIP, state housing estimates, and PVGIS.
Get a Victorville solar estimate tied to your demand
A strong roof output is the opening fact. The bill, the usage hours and the terms decide whether the offer holds up.
What does your monthly electric bill look like?
Victorville average is $167 per month (EIA, 2024).