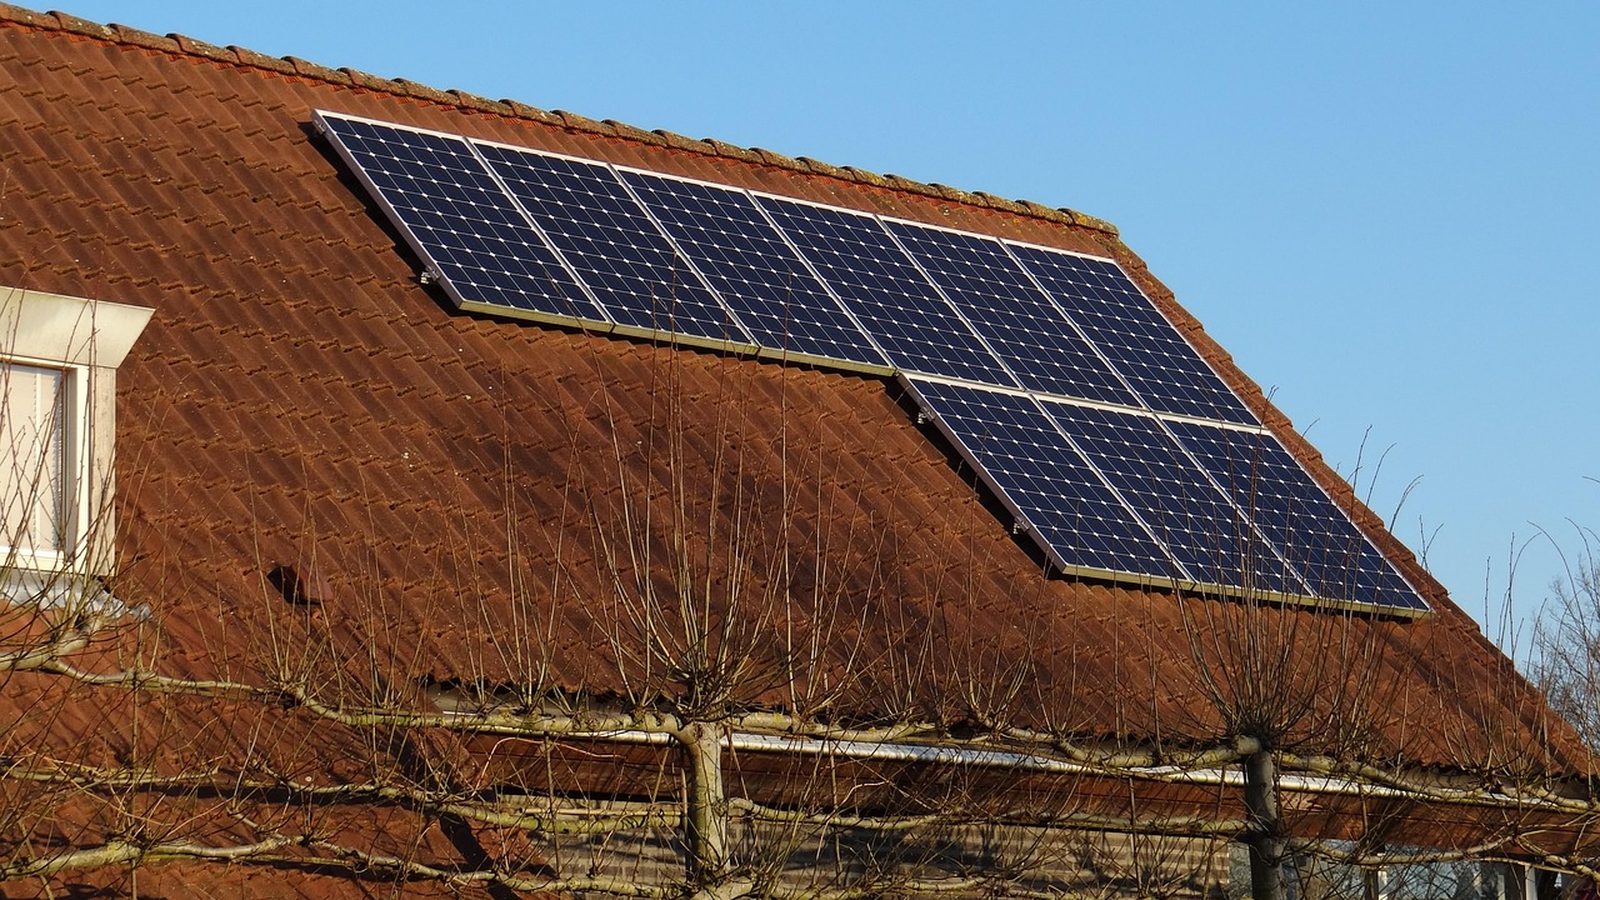
Photo: wooolff, via Pixabay
California · Westminster
Westminster solar: the city that does the paperwork
Written by the Solar Learning Lab research deskUpdated August 27, 202611 min read
Every California city over 50,000 people was supposed to stand up automated solar permitting by September 2023 and report on it annually. Plenty stood up the platform. Far fewer keep reporting. In the California Energy Commission tracking file updated August 3, 2026, Westminster is the only city among the five we researched this week with a 2025 annual report on file. Small thing? Maybe. But when a building department keeps filing state reports nobody reads, it usually keeps its counters, portals, and inspection queues in order too.
The substance backs up the signal. Westminster runs residential solar designs through SolarAPP+ for automated code review, then its Energov system issues the permit automatically. Electricity is bundled Southern California Edison, no community choice layer, in a city where households average 3.218 people, the largest in our five-city batch. Big households consume more of their own solar, and that changes the math in a way most generic calculators miss.
Start from production, not promises
Our Westminster model gives you a neutral yield figure to hold every bid against.
Open the estimatorWhy a filed report is worth your attention
The state mandate comes from Government Code 65850.52, added by SB 379: an online automated platform that checks code compliance and issues residential solar permits in real time to licensed contractors, up to 38.4 kW AC for solar and the same for paired storage. Compliance gets reported to the CEC, which is careful to say it does not certify compliance and cannot enforce it. So the tracker is an honor system, which is exactly why the reporting column is informative. Westminster's record shows the SolarAPP+ platform, a $60,000 CalAPP grant awarded April 18, 2023, and 2025 report data on file.
The city's own solar permit process page names SB 379, cites the 38.4 kW thresholds, and describes the automated review with auto-issued permits. City page and state record agree. When those two sources match, a contractor's permitting timeline claims become checkable instead of anecdotal.
How auto-issuance actually works here
Licensed contractors submit residential roof mounted photovoltaic designs through SolarAPP+, which runs the automated plan review. The result flows into Energov, the city's permitting software, and an auto-issued permit comes out. The path is restricted to licensed contractors and to designs meeting the eligibility requirements; owner-builders and unusual designs deal with the Building Division directly. The division also runs online permit application and tracking through its Westminster Build portal, with named staff on its contact page, from the Building Official down to the permit technician.
One access note for the detail-obsessed: Westminster's municipal code is hosted on a platform that blocks automated retrieval, so unlike some neighboring cities we cannot quote a local expedited-solar ordinance section here. The observable process, documented on the city's pages, is the streamlined SolarAPP+ and Energov path described above.
One blank in the fee schedule
The City Council adopted a new Community Development fee schedule effective September 1, 2025, published with a FY 2025 to 2026 Fee Comparison Report. We read it. There is no solar or photovoltaic line in the fetched report, and no other city page we retrieved states the solar permit fee. Until the Building Division confirms a figure, the honest number to plan around is the statewide ceiling: Government Code 66015 caps residential PV permit fees at $450 plus $15 per kW above 15 kW, and exceeding that requires adopted written findings.
Call (714) 548-3254 or email Wbuilding@westminster-ca.gov and ask for the current residential PV permit cost under the September 2025 schedule. Two minutes on the phone beats a surprise line item at contract signing.
Bills in a full-house city
Westminster sits in SCE's index of communities served under Baseline Regions 6 and 8, and generation is bundled SCE: the city is not an Orange County Power Authority member, per OCPA's own FAQ, and does not appear on SCE's CCA list. Across SCE's residential base the 2024 average price was 32.4 cents per kWh, per EIA Table 6.
| Energy source | Type | Average price | What that means |
|---|---|---|---|
| SCE TOU-D-4-9PM | October to May super off peak, 8 a.m. to 4 p.m. | 33¢ per kWh | 23¢ after baseline credit. This is the window rooftop solar displaces most. |
| SCE TOU-D-4-9PM | summer weekday on peak | 58¢ per kWh | 48¢ after credit; weekend mid peak 46¢. |
| SCE TOU-D-5-8PM | summer on peak, 5 to 8 p.m. | 74¢ per kWh | 64¢ after credit. Both plans carry a $0.79 per day Base Services Charge. |
| Rooftop solar | self-consumed output | avoided import price hour dependent | A household of three-plus people running daytime loads keeps more production behind the meter at retail value. |
Posted rates from SCE's time of use plan pages. Snapshot for orientation, not billing simulation.
Here is the Westminster-specific read. At 3.218 persons per household, with 15,686 single detached homes and 54.4 percent of the stock single detached, this is a city of full houses: someone is usually home, laundry runs in daylight, and cooling runs into the evening. That load shape converts more solar production into avoided retail purchases instead of low-value exports, which quietly improves payback relative to a commuter city with identical panels.
Export credits, realistically
Interconnection applications from April 15, 2023 onward take the Net Billing Tariff: consumption and production are not netted, exports earn hourly Avoided Cost Calculator values averaged monthly and split by weekday versus weekend, with monthly charges and an annual true up. Decision 22-12-056 gives SCE residential customers an ACC Plus adder of 4 cents per exported kWh, and 9.3 cents for CARE, FERA, disadvantaged community resident owners, or California Indian Country customers, held constant for nine years from interconnection. Later enrollees see the adder step down 20 percent per year until it zeroes out after year five, and buyers of homes with existing systems get nothing.
The 9.3 cent income-qualified adder deserves more airtime in Westminster than in most Orange County cities. With a median household income of $82,686 and a 15.8 percent poverty rate, a meaningful share of local households can plausibly qualify through CARE or FERA. An installer who never asks about CARE enrollment is leaving your money on the table.
Yield on a Westminster roof
The downtown Westminster model returns 1,727.4 kWh per year per installed kW, with August at 165.5 kWh per kW and December at 114.4. April models slightly above May here, 162.6 against 160.7, a coastal-plain quirk worth noticing before the marine gloom months arrive.
August models at 165.5 kWh per kW. In a full-house city, the question is how much of it gets used before it hits the meter.
PVGIS v5.2 model run by Solar Learning Lab on August 27, 2026, NSRDB radiation database. Fixed south facing mount, 30 degree tilt, 14 percent losses, downtown Westminster coordinates. Your roof will differ. Model documentation at PVGIS. Housing here is dominated by 1950s to 1970s construction, so roof condition and panel-era electrical service deserve a hard look before anyone signs a production guarantee against this figure.
Programs that fit this city better than its neighbors
The SGIP Residential Solar and Storage Equity budget, $280 million with reservations open since June 2, 2025, pays $3,100 per kW for solar and $1,100 per kWh for storage to income-qualified households, with a one year window to meet requirements including demand response enrollment. DAC-SASH, administered by GRID Alternatives through 2030, serves CARE or FERA customers in top-quartile CalEnviroScreen tracts. Given Westminster's income profile, these are not footnote programs here; they are the difference between a project penciling and not.
Three more local realities. First, 2,999 of the city's 28,820 housing units, about 10.4 percent, are mobile homes, which generally cannot host standard rooftop PV; if that is your situation, the conversation is different. Second, Westminster anchors Little Saigon, the largest ethnically Vietnamese community outside Vietnam, and none of the state or city solar resources we reviewed offer Vietnamese-language permit help, so a bilingual installer carries real value. Third, the property tax new construction exclusion still shields qualifying systems from reassessment until its scheduled January 1, 2027 sunset, and the federal homeowner credit is over: 25D ended for expenditures after December 31, 2025, per CRS IN12611.
Contractor snapshot
The Westminster-area map results run from an Instagram-fronted local outfit to established Garden Grove and Huntington Beach firms with triple digit review counts. Ask every bidder the accountability question this page is built on: when did you last pull an auto-issued permit through Westminster's SolarAPP+ and Energov path, and how long did inspection scheduling take.
Solar Panel Option
Westminster, CA
4.8(5 Google reviews)
Aikyum Solar
Westminster, CA
4.9(63 Google reviews)
Evergreen Solar and Home Battery
Huntington Beach, CA
5.0(24 Google reviews)
Southwest Sun Solar
Garden Grove, CA
4.0(65 Google reviews)
Repower Westminster
Midway City, CA
0.0(0 Google reviews)
Nexus Energy Systems
Garden Grove, CA
4.6(165 Google reviews)
Ratings snapshot: Google Maps, August 2026, via the DataForSEO SERP feed. Zero companies paid us and none are endorsed by us.
Try the numbers yourself
The estimator pairs the state average rate with the Westminster production run. It does not know your household size, which in this city is the variable that matters most, so treat its output as a floor-to-ceiling band and let your daytime usage decide where in the band you land.
The slider tops out at our Westminster PVGIS figure of 1,727 kWh per installed kW. The floor is 85 percent of it, covering typical shade and orientation losses on the city's 1950s to 1970s housing stock.
Cash quotes in Westminster cluster near $2.46 per watt, against a $3.50 national 2024 median (LBNL). Use your quote.
Assumptions you can change
Use the rate on your actual lease or PPA quote. There is no published statewide average we trust enough to hardcode.
Cash purchase
$8,364 after state credit
- Year 1 benefit
- $163/mo
- Payback
- 5 years
- 20 year net position
- $39,026
Westminster households buy bundled SCE service with no community choice layer, and at 3.218 persons per household the city runs bigger than average loads. More people home during the day generally means more solar output consumed at retail value instead of exported.
Solar loan
$112/mo 15 yr payment
- Year 1 net
- $51/mo
- Upfront
- $0
- 20 year net position
- $27,256
Loan pricing here uses the documented state loan-over-cash spread. With Westminster's median income at $82,686, the gap between a cash price and a dealer-fee-loaded loan matters more than in wealthier Orange County cities, so demand both numbers.
Lease / PPA
$0 down you buy the power
- Year 1 net
- $45/mo
- Upfront
- $0
- 20 year net position
- $14,827
If a third party provider pitches a lease, remember the provider's tax benefits belong to the provider. The rate you sign still has to undercut SCE's TOU-D import prices for the hours your family actually uses power.
Estimates, not quotes. Inputs use the California average retail rate, our downtown Westminster PVGIS run and state market cost data. The tool cannot model SCE baseline allocations for regions 6 and 8, hourly export credits or the ACC Plus adder. We are a solar installer and we also partner with other solar companies. See our disclosures.
We are a solar installer and we also partner with other solar companies.
Westminster answers, sourced
Is Westminster's solar permit really automatic?
What will the permit cost me?
Does Westminster have a community choice energy provider?
What do exports pay on a new Westminster system?
Can a mobile home get rooftop solar?
Is there any federal credit left for a 2026 purchase?
Receipts
The primary records behind this page, all reviewed August 27, 2026.
- Westminster solar permit process, Building Division, and building forms and fees
- FY 2025 to 2026 Fee Comparison Report
- CEC residential solar permitting tracker and Government Code 65850.52
- SCE community index, SCE TOU plans, SCE CCA list, OCPA FAQ, and EIA Table 6
- CPUC Net Billing Tariff and Decision 22-12-056
- CPUC SGIP, DAC-SASH, BOE property tax exclusion, Government Code 66015, Civil Code 714, and CRS IN12611
- DOF E-5 housing estimates, Westminster overview, and PVGIS
Get a Westminster estimate built on your household's load
Your household size and daytime usage drive the value here. Start with the bill and we will frame the right questions for bidders.
What does your monthly electric bill look like?
Westminster average is $161 per month (EIA, 2024).