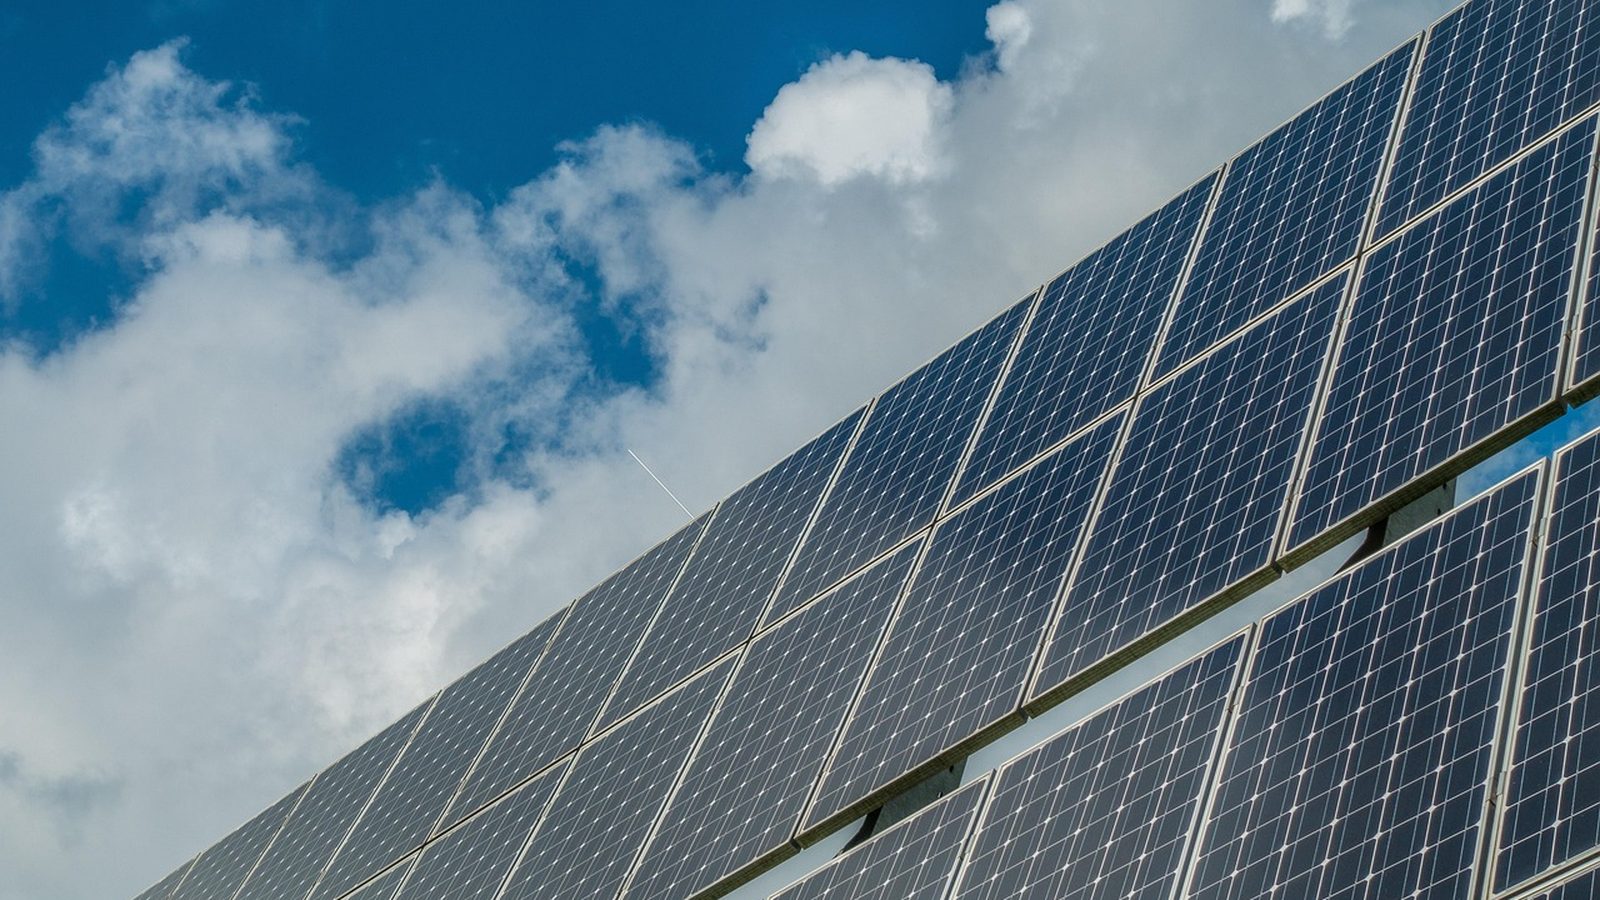
Photo: mrganso, via Pixabay
California · Jurupa Valley
Jurupa Valley already lived through a power provider collapse
Written by the Solar Learning Lab research deskUpdated August 25, 202612 min read
In May 2020, Jurupa Valley households were automatically enrolled in Western Community Energy, a community choice aggregator serving seven western Riverside County cities. Thirteen months later it was gone. The WCE board declared a fiscal emergency and filed for Chapter 9 bankruptcy on May 24, 2021, and every customer was returned to Southern California Edison on June 15, 2021. The CPUC record of the bankruptcy and the original launch announcement bookend the whole episode.
Why open a solar page with a utility obituary? Because stale information about WCE still circulates, because this city's utility landscape genuinely confuses people, and because a solar quote built on the wrong provider assumptions produces the wrong payback. Everything below starts from the corrected picture: SCE generates, delivers, and bills, and the net billing rules that govern your exports are SCE rules.
Skip the folklore, run the model
Our Jurupa Valley production run and the current SCE framework are loaded into the estimator below.
Try the estimatorThirteen months of community choice, start to finish
The timeline is short enough to state completely. A joint powers authority formed in 2018 after feasibility work that began in 2016, with Canyon Lake, Eastvale, Hemet, Jurupa Valley, Norco, Perris, and Wildomar as members. Norco, Perris, and Wildomar got service in April 2020; Eastvale, Hemet, and Jurupa Valley followed in May 2020. The default Choice Plan carried a minimum 37 percent renewable content, with a 100 percent option called Choice Plus, and SCE kept delivering the power and issuing the bills throughout. Launch documentation.
Then the collapse: fiscal emergency declared, Chapter 9 filed May 24, 2021, customers back on SCE bundled service June 15, 2021, and a plan of adjustment conditionally confirmed by the bankruptcy court on July 14, 2022. The CPUC's May 2026 formation status report still carries the entry. 2026 CCA status report and bankruptcy filing record. The practical takeaway for solar shoppers: any rate sheet, sales script, or old blog post referencing WCE generation rates describes a company that stopped serving customers in 2021. No CCA on SCE's current active list covers Jurupa Valley today. SCE's list.
Rubidoux CSD is real. It just does not sell electricity.
The second layer of local confusion involves the Rubidoux Community Services District. RCSD serves roughly 35,000 people in an area that now lies entirely inside Jurupa Valley, and its service list is long: water, wastewater, fire protection, trash collection, street lighting, weed abatement. Electricity is not on it. RCSD is an SCE customer itself, paying SCE bills for the street lights it maintains. A homeowner inside the RCSD boundary still interconnects solar with SCE. RCSD's own overview document.
The City's materials settle the rest. Its utilities business directory names Southern California Edison for electricity, and its Public Safety Power Shutoff page routes residents to SCE customer service and outage lines. We could not confirm any Riverside Public Utilities electric service inside Jurupa Valley from the sources we reviewed, so we make no claim about RPU territory in either direction. When in doubt, the name on your electric bill is the answer. City utility directory and City PSPS page.
Crossing into Riverside changes the price of a kilowatt hour
EIA's 2024 data shows SCE's average residential price at about 32.4 cents per kWh, while the City of Riverside's municipal utility, directly across the city line, averaged about 20.2 cents. Jurupa Valley homeowners pay the higher of those two numbers, which cuts against the household budget and, at the same time, strengthens the case for offsetting usage with rooftop production. Expensive retail power is what solar competes against. EIA Table 6.
| Energy source | Type | Average price | What that means |
|---|---|---|---|
| SCE | 2024 residential average | 32.4¢ per kWh | The utility serving Jurupa Valley households. |
| Riverside Public Utilities | 2024 residential average, next door | 20.2¢ per kWh | Shown for contrast only; municipal territory across the city line. |
| SCE TOU-D-4-9PM | summer weekday on-peak, 2026 | 58¢ per kWh | Against 34¢ off-peak in the same season. |
| Rooftop production | used inside the home | offsets SCE retail hour by hour | Exports are credited separately and lower: 2026 summer averages run 6¢ daytime, 21¢ evening, 12¢ overnight. |
EIA 2024 averages, SCE TOU pricing, and Solar Billing Plan credits. A snapshot for orientation, not a bill projection.
The framework behind exports: interconnections since April 15, 2023 fall under the CPUC's net billing tariff, with solar customers served on TOU-D-PRIME, and residential applicants before the end of 2027 receive an added export credit near 4 cents per kWh, held for a nine year term. Tiered customers otherwise pay 30 to 40 cents per kWh in the two standard brackets. CPUC tariff decision, SCE plan detail, tiered rates.
The permit file: a working fast lane and one missing dollar figure
Jurupa Valley runs SolarAPP+ against its Accela portal, and the City says same-day approval is possible for conforming projects: design approved at solarapp.nrel.gov, then a portal application carrying the SolarAPP+ approval number and document. Eligibility is rooftop only, on the main permitted dwelling, licensed contractors only; ballasted and ground mounted systems are out, which pushes detached garage and accessory structure designs into regular review. The SolarAPP+ processing fee covers up to three revisions. City Solar App page.
Here is what we could not find: the City's own permit price. Municipal Code 8.05.060(E), adopted by Ordinance 2017-14 on September 21, 2017, says solar permit fees are set by City Council resolution, and no photovoltaic line item appears in the consolidated fee chapter we reviewed. So we will not print a number nobody published. Call Building and Safety at (951) 332-6464 for the current amount, and for reference, Government Code 66015 sets $450 up to 15 kW plus $15 per kW above as the default statewide ceiling absent a written finding. Ordinance text, Building and Safety, statute.
Small operational notes that save time. The City warned on October 15, 2025 that Chrome users may hit a 500 error in the permit portal; use Edge, Firefox, or Safari. Revisions go by email with the full unstamped plan set, clouded changes, structural calcs, and a revision letter, so sloppy plan sets cost calendar days here. The state's CEC tracker lists the city as a SolarAPP+ platform jurisdiction with an $80,000 CalAPP award dated February 9, 2023, the earliest award among its neighbors, though no annual report on file. Permits page, revision process, CEC dataset, the statute it implements.
Solar is not experimental here. The City counted 128 permits in July.
The City's own monthly report shows 128 solar photovoltaic permits issued in July 2025 alone. In a city of about 29,551 housing units, that is a meaningful monthly clip, and it means your neighbors, inspectors, and the permit counter have all done this many times. Use that maturity: ask bidders how many Jurupa Valley jobs they closed in the last year, and expect a specific answer. City permit report and housing count.
Modeled yield: 1,737.3 kWh per kW per year
Our downtown Jurupa Valley run lands at 1,737.3 kWh annually per installed kW, with August at the top of the curve at 167.3 kWh per kW and December at the bottom at 113.9. Solid inland numbers, a touch below Menifee and Murrieta in our same-day runs, and comfortably enough resource that system economics turn on rates and self-consumption rather than on sunshine.
167.3 kWh per kW in August. The question worth asking is not whether the sun shows up but how much of this output your household uses before 4 p.m.
PVGIS v5.2 model run by Solar Learning Lab on August 25, 2026, NSRDB radiation database. Fixed south facing mount, 30 degree tilt, 14 percent losses, downtown Jurupa Valley coordinates. Your roof will differ. Generated with PVGIS. Any proposal claiming meaningfully more than this for a standard roof should arrive with a shade report and an orientation argument, not just confidence.
A young city with the fullest houses in the valley
Jurupa Valley incorporated on July 1, 2011, stitched together from nine communities including Mira Loma, Pedley, Glen Avon, and Rubidoux. The state's 2026 file gives it the tightest vacancy rate of the four cities we researched, 2.86 percent, and the largest households, 3.64 persons each. Full houses use more electricity, and ACS 2023 data adds that 20.8 percent of homes heat with electricity, the highest share in this four-city set. Bigger baseline loads generally shorten solar payback. DOF E-5 and US Census Bureau, ACS 5-year estimates, 2023.
Ownership fundamentals hold up too: 70.2 percent of the city's 27,132 households own their homes, 82.0 percent of housing is single family, and median income is $96,190. One structural caveat: 1,879 units, about 6.4 percent, are mobile homes, and the SolarAPP+ fast lane covers only permitted main dwellings, so that slice of the market moves through slower review. Census ACS and eligibility limits.
Programs worth checking, and the shutoff calendar nobody controls
The City maintains a dedicated PSPS page for a reason. SCE notifies customers about 48 hours before a potential shutoff and again around 24 hours out, and it presented its PSPS program to the City Council on February 27, 2025. The same page points to SCE resources that include income-qualified solar installation, a Critical Care Backup Battery program, and Medical Baseline. SCE can de-energize any circuit that passes through elevated fire threat districts, so an address here can go dark while its own street feels calm. That, plus a 21 cent evening export credit against a 58 cent evening retail price, is the storage case stated without decoration. City PSPS page, SCE shutoff criteria, export values.
On money: the federal 25D homeowner credit is over for post-2025 completions under P.L. 119-21. CRS IN12611. SGIP's equity budget pays income-qualified customers $3,100 for each solar kW and $1,100 for each storage kWh. CPUC SGIP. DAC-SASH runs no-cost installs through GRID Alternatives in top-quartile CalEnviroScreen tracts through 2030; given the industrial corridor running through this city, checking your parcel's CalEnviroScreen status is worth ten minutes. Program page. The state property tax exclusion for active solar systems runs until its January 1, 2027 sunset, and Civil Code 714 keeps HOAs from effectively blocking a system. BOE and statute.
The bidding field is based in Riverside and Norco
August 2026 Maps results for Jurupa Valley skew toward Riverside-headquartered companies, with review counts from 56 to 369. Because this city's fast lane depends on clean SolarAPP+ submittals and email-based revisions, prioritize crews that can name the City's process from memory, including the browser quirk and the three-revision allowance.
Mohr Power Solar Inc.
Norco, CA
4.4(107 Google reviews)
Luxor Energy
Riverside, CA
4.3(106 Google reviews)
Solar Service Professionals
Riverside, CA
4.8(100 Google reviews)
Vanwarner Construction
Riverside, CA
4.9(56 Google reviews)
Ratings snapshot: Google Maps, August 2026, via the DataForSEO SERP feed. Zero companies paid us and none are endorsed by us.
Your numbers, minus the sales gravity
The estimator pairs our Jurupa Valley production run with statewide rate and cost inputs. It will not simulate hourly exports or your panel's shading, and it does not know the City's unpublished permit fee. It will give you a size and payback frame sturdy enough to argue with.
The slider tops out at our modeled 1,737 kWh per kW for downtown Jurupa Valley and bottoms at 85 percent of that, a buffer for orientation and shade rather than a measured result.
Cash quotes in Jurupa Valley cluster near $2.46 per watt, against a $3.50 national 2024 median (LBNL). Use your quote.
Assumptions you can change
Use the rate on your actual lease or PPA quote. There is no published statewide average we trust enough to hardcode.
Cash purchase
$8,118 after state credit
- Year 1 benefit
- $159/mo
- Payback
- 5 years
- 20 year net position
- $38,141
The avoided-cost input here is the California average retail rate. Jurupa Valley households are SCE customers, and EIA put SCE's 2024 residential average near 32.4 cents per kWh, roughly 12 cents above the neighboring Riverside municipal utility, so the payback pressure on this side of the city line is higher than the state figure implies.
Solar loan
$109/mo 15 yr payment
- Year 1 net
- $50/mo
- Upfront
- $0
- 20 year net position
- $26,718
The financed figure includes the statewide loan-over-cash spread we document at the state level. In Jurupa Valley, also note that no city PV permit fee is published; the City sets solar fees by Council resolution, so ask Building and Safety at (951) 332-6464 for the current amount and get it into the quote in writing.
Lease / PPA
$0 down you buy the power
- Year 1 net
- $44/mo
- Upfront
- $0
- 20 year net position
- $14,474
The federal homeowner purchase credit ended for expenditures after December 31, 2025, and the CRS analysis we cite speaks only to that credit, not to how lease or PPA companies are taxed. Any incentive a third-party provider mentions belongs in the signed agreement, with the rate escalator next to it.
Estimates, not quotes. This model uses the California average retail rate, our downtown Jurupa Valley PVGIS run, and statewide cost inputs. It cannot reproduce SCE hourly export credits, the pre-2028 adder, or your roof's shading. We are a solar installer and we also partner with other solar companies. See our disclosures.
We are a solar installer and we also partner with other solar companies.
Jurupa Valley questions, straight answers
Who is my electric utility, SCE or Rubidoux CSD?
Whatever happened to Western Community Energy?
How much does the city permit cost?
Can my permit really come through the same day?
Does anyone actually go solar here?
Verification links
Reviewed August 25, 2026. The one figure we could not verify, the City's own permit price, is flagged as unpublished above rather than estimated.
- solarApp: https://www.jurupavalley.org/581/Solar-App
- permits: https://www.jurupavalley.org/406/Permits
- buildingSafety: https://jurupavalley.org/165/Building-Safety
- permitVolume: https://www.jurupavalley.org/DocumentCenter/View/4434
- utilityDirectory: https://www.jurupavalley.org/BusinessDirectoryII.aspx?lngBusinessCategoryID=24
- cityPsps: https://www.jurupavalley.org/488/Public-Safety-Power-Shutoffs-PSPS
- rcsd: https://www.rcsd.org/files/f3380725f/RCSD+About+20201015.pdf
- ordinance: https://library.municode.com/ca/jurupa_valley/codes/municipal_code?nodeId=TIT8BUCO_CH8.05ADCOCO_S8.05.060EXRESMREROSOENSYPE
- wceLaunch: https://cdnsm5-hosted.civiclive.com/UserFiles/Servers/Server_9894739/File/News/WCE%20Launches%20in%20Six%20Cities.pdf
- ccaReport: https://www.cpuc.ca.gov/-/media/cpuc-website/divisions/energy-division/documents/community-choice-aggregation-and-direct-access/2026-cca-and-esp-formation-status-report.pdf
- wceBankruptcy: https://docs.cpuc.ca.gov/PublishedDocs/Efile/G000/M496/K284/496284567.PDF
- sceCca: https://www.sce.com/customer-service-center/community-choice-aggregation
- feeCap: https://law.justia.com/codes/california/code-gov/title-7/division-1/chapter-7-5/section-66015/
- sb379: https://law.justia.com/codes/california/code-gov/title-7/division-1/chapter-4/article-2/section-65850-52/
- cecTracking: https://www.energy.ca.gov/sites/default/files/2026-08/Residential_Solar_Permitting_Program_Data_2026-08-03_ada.xlsx
- sceTiered: https://www.sce.com/save-money/rates-financing/residential-rate-plans/tiered-rate-plan
- sceTou: https://www.sce.com/residential/rates/Time-Of-Use-Residential-Rate-Plans
- sceSbp: https://www.sce.com/clean-energy-efficiency/solar-generating-your-own-power/billing-incentives/solar-billing-plan
- scePsps: https://www.sce.com/outages-safety/outage-preparedness/outage-types/public-safety-power-shutoff-psps
- netBilling: https://www.cpuc.ca.gov/industries-and-topics/electrical-energy/demand-side-management/customer-generation/net-energy-metering-and-net-billing
- sgip: https://www.cpuc.ca.gov/industries-and-topics/electrical-energy/demand-side-management/self-generation-incentive-program
- dacSash: https://gridalternatives.org/what-we-do/program-administration/dac-sash
- propTax: https://www.boe.ca.gov/proptaxes/active-solar-energy-system/
- federal: https://www.congress.gov/crs-product/IN12611
- housing: https://dof.ca.gov/media/docs/forecasting/Demographics/estimates/e-5-population-and-housing-estimates-for-cities-counties-and-the-state-2020-2026/E-5_2026_InternetVersion.xlsx
- eia: https://www.eia.gov/electricity/sales_revenue_price/xls/table_6.xlsx
- hoa: https://law.justia.com/codes/california/code-civ/division-2/part-1/title-2/chapter-2/article-2/section-714/
- PVGIS production model: https://re.jrc.ec.europa.eu/pvg_tools/en/
- US Census Bureau, ACS 5-year estimates, 2023: https://data.census.gov/
Start from your SCE bill, not from a pitch deck
Four questions and we return a sizing range grounded in the local production run and your usage.
What does your monthly electric bill look like?
Jurupa Valley average is $167 per month (EIA, 2024).