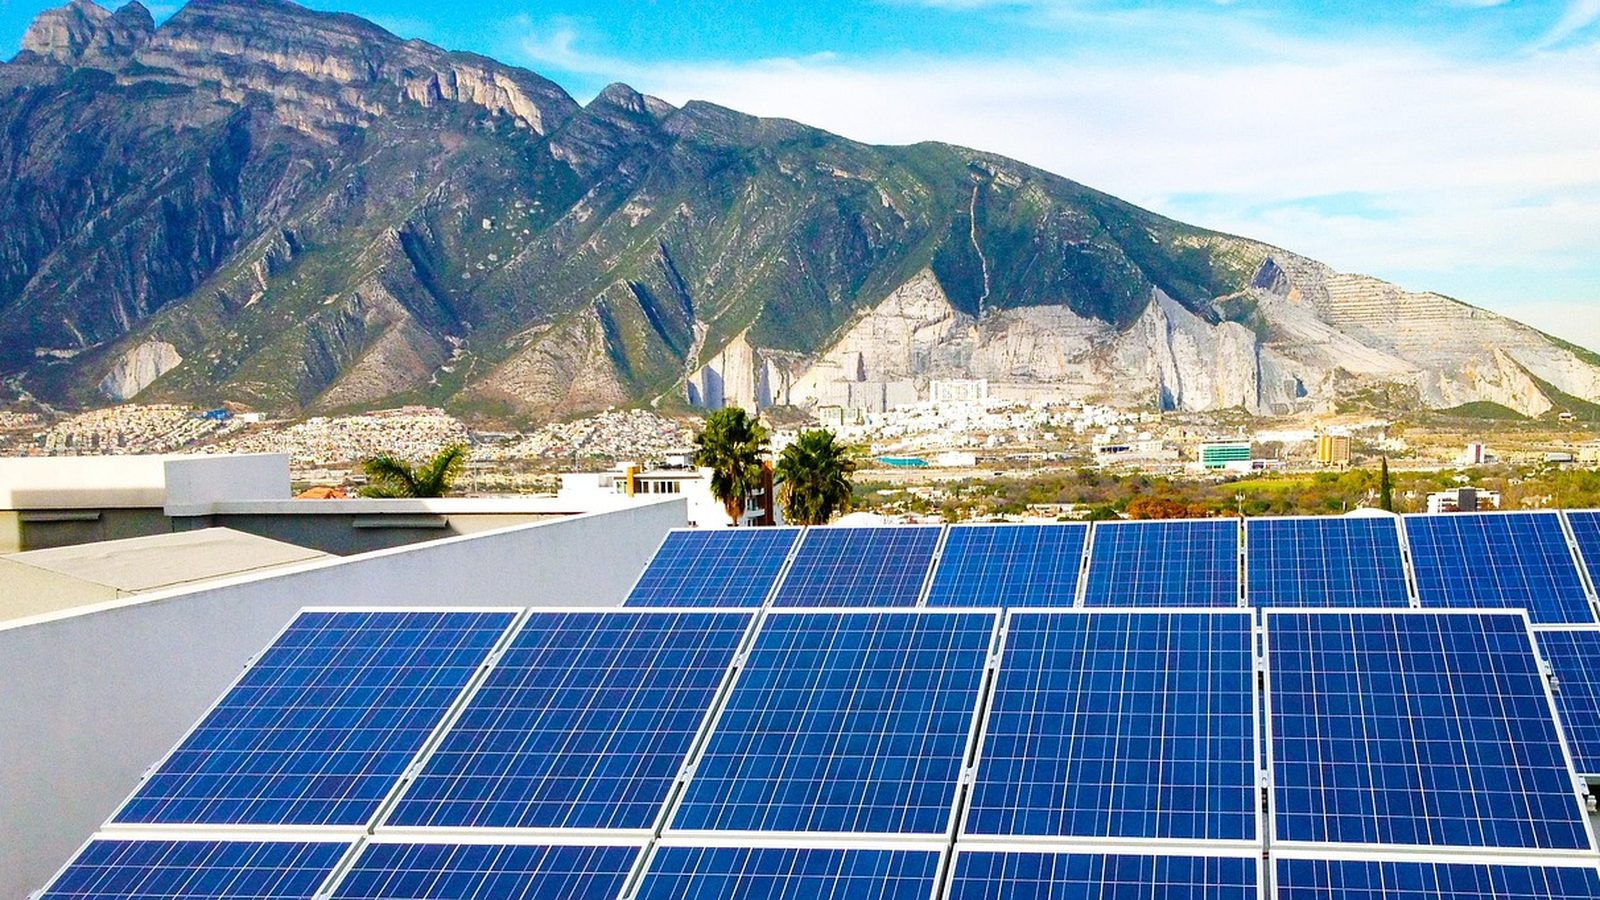
Photo: chrischesneau, via Pixabay
California · San Marcos
Solar in San Marcos: one bill, two power sellers
Written by the Solar Learning Lab research deskUpdated August 27, 202612 min read
Here is the detail most San Marcos solar quotes skip. Since April 1, 2023, the default generation provider for San Marcos residents has been the Clean Energy Alliance, a community choice aggregator, on its Clean Impact Plus product. SDG&E still owns the wires and still sends the bill, but for most households it no longer sells the electrons. A proposal that models your savings against a plain SDG&E account may be modeling a customer you stopped being three years ago.
That split does not make solar a worse idea here. San Diego County retail prices are the highest in any market we cover, and the sun is generous. It just means the first question to ask any installer is which generation arrangement their spreadsheet assumes. This page walks through the CEA structure, the city's unusually cheap permit, SDG&E's 2026 pricing, and where export credits actually land.
Check the math before the pitch
Run a screening estimate with our San Marcos production model, then make every quote reconcile against it.
Estimate San Marcos solarWho actually sells you power in San Marcos
The Clean Energy Alliance launched service in San Marcos and Escondido on April 1, 2023, and residents were enrolled automatically in Clean Impact Plus, which CEA describes as 50 percent renewable and 75 percent carbon free. You can opt up to Green Impact at 100 percent renewable, opt down to Clean Impact at 50 percent renewable, or opt out entirely and return to bundled SDG&E generation. CEA's member cities are Carlsbad, Del Mar, Escondido, Oceanside, San Marcos, Solana Beach, and Vista. CEA's launch announcement lays all of that out.
None of this changes who keeps the lights on. SDG&E delivers the energy, maintains the grid, and issues one combined bill. And to clear up a common confusion in north county: San Marcos is not Southern California Edison territory. The city does not appear in SCE's filed index of communities served. If a door knocker quotes you SCE rates, the conversation can end there.
For solar owners specifically, CEA runs a program it calls Personal Impact, designed to mirror SDG&E's net energy metering structure while paying a higher net surplus compensation rate than SDG&E on excess energy your system produces. Same delivery company, same combined bill, different buyer for your surplus. That is the wrinkle a good quote has to name.
The one-question test for any San Marcos quote
Ask this before you discuss panels, batteries, or financing: does this proposal assume CEA generation or bundled SDG&E generation? If the salesperson cannot answer, the savings number on the cover page is decorative. The two arrangements price your consumption differently and compensate your surplus differently, and CEA advertises the better net surplus rate. A spreadsheet that ignores the distinction is not wrong by a rounding error; it is wrong by design.
What we have seen in practice is that most templated proposals default to bundled utility assumptions because that is what the software ships with. In a city where the default customer has been on Clean Impact Plus since 2023, the burden of proof sits with the installer. Make them show which line items come from CEA and which from SDG&E. If you have opted out and genuinely are a bundled SDG&E customer, say so, and make the quote say so too.
A $120 permit, and a city that publishes its fees
San Marcos prices a residential rooftop PV permit at $55 for plan check plus $65 for the permit, $120 all in, per the Development Services fee schedule effective March 3, 2025. State law caps residential PV permit fees at $450 plus $15 per kW above 15 kW under Government Code 66015, so the city sits at roughly a quarter of the ceiling. Storage adds a $50 energy storage system permit. Cheap, published, and verifiable: that combination is rarer than it should be.
Process depends on who files. Single family homeowners using the city's standard central inverter or micro inverter plans complete an eligibility checklist and submit through the city's online portal under the Roof Mounted Solar PV Expedited option, with an estimated 1 to 3 business days of processing. Licensed contractors instead self-issue through SolarAPP+ in six published steps, which include obtaining a San Marcos business license and attaching a Permit Declaration Form in the city's permitting system. No completed declaration form, no inspection scheduling. Systems that fit neither lane, including multifamily and commercial, go to full plan review at 5 to 10 business days. The city's solar permit page defines the small system threshold as 10 kW of electricity or less.
The California Energy Commission's permitting tracker, updated August 3, 2026, lists San Marcos on the SolarAPP+ platform with 2024 annual report data on file and a $60,000 CalAPP grant awarded November 6, 2023. One practical note: the city operates two websites, sanmarcosca.gov and the legacy san-marcos.net, and the published counter hours live on the legacy page. Confirm hours at 760-744-1050 ext. 3244 before driving over.
What SDG&E charges in 2026, and why payback runs fast here
SDG&E's 2024 residential average worked out to 43.6 cents per kWh across 307,982 residential customers, per EIA Table 6. That is the highest average of any utility in this research set. On the standard TOU-DR1 schedule, the totals effective January 1, 2026 look like this:
| Energy source | Type | Average price | What that means |
|---|---|---|---|
| SDG&E TOU-DR1 | summer on peak, 4 to 9 p.m. | 69.7¢ per kWh | $0.69654 total rate. Off peak 47.6¢, super off peak 38.8¢. |
| SDG&E TOU-DR1 | winter on peak | 62.2¢ per kWh | Off peak 54.0¢, super off peak 44.9¢. |
| SDG&E TOU-DR1 | baseline credit | 10.9¢ credit per kWh | $0.10905 credit applies up to 130 percent of baseline. Base Services Charge $0.79343 per day. |
| Rooftop solar | self-consumed output | avoided retail not a tariff | Every solar kWh used onsite avoids the applicable TOU price. Exports follow a separate credit mechanism described below. |
Rates from the SDG&E TOU-DR1 total rates table effective 1/1/2026 and the SDG&E pricing plans page. Snapshot, not a bill forecast.
SDG&E also lists DR-SES as an additional option for solar customers and flags EV-TOU-5 as suited to Solar Billing Plan households, and it notes most plans are available whether your generation comes from a CCA or from SDG&E. The pattern to internalize: a kWh your panels displace at 4 p.m. on a July weekday is worth nearly 70 cents. The same kWh exported is worth far less. Load timing is the whole game in this territory.
Exports here come without the adder other utilities get
New interconnections fall under the CPUC's Net Billing Tariff, adopted December 15, 2022 in Decision 22-12-056 and applied to applications submitted on or after April 15, 2023. Consumption is not netted against production. Exports are compensated using hourly Avoided Cost Calculator values averaged monthly, split between weekday and weekend or holiday periods, with monthly charges and an annual true up. Systems that qualified earlier keep a nine year legacy period.
Now the part specific to this zip code. Decision 22-12-056 set the ACC Plus export adder for SDG&E residential customers at exactly $0.000 per kWh, for general and low income customers alike, on the reasoning that SDG&E customers already hit the nine year payback target without help. SCE customers get 4 cents, PG&E customers 2.2 cents. So if a proposal for a San Marcos roof includes an adder line, someone imported the wrong utility's numbers. The payback case here rests on brutal retail prices and strong sun, not on export sweeteners, and CEA's higher net surplus compensation is the only local upgrade on the export side.
Modeled output: 1,732 kWh per installed kW
Our downtown San Marcos model produces 1,732.0 kWh per year for each installed kW. August leads at 165.8 kWh per kW and December trails at 115.7. Local weather explains the shape: the research on this area notes cool Pacific overcast in May and June, the familiar May gray and June gloom, followed by a warm July through September stretch. The monthly curve is flatter than inland deserts but the annual total still lands near the top of our California runs.
August is the modeled peak at 165.8 kWh per kW, arriving right as SDG&E summer on peak pricing makes each displaced kWh most valuable.
PVGIS v5.2 model run by Solar Learning Lab on August 27, 2026, NSRDB radiation database. Fixed south facing mount, 30 degree tilt, 14 percent losses, downtown San Marcos coordinates. Your roof will differ. Full model at PVGIS. Treat it as a standardized reference for comparing roofs and bids, never as a promise about your specific shading, azimuth, or panel layout.
Incentives that survived into 2026, and one that did not
The federal 25D homeowner credit is gone for new projects. P.L. 119-21 terminated the 30 percent Residential Clean Energy Credit for expenditures made after December 31, 2025, and the tax code treats an expenditure as made when installation is completed. A purchase completed in 2026 gets no 25D credit; carryforwards from pre-2026 expenditures survive. CRS report IN12611 is the controlling summary, and it does not address third party ownership, so we make no lease or PPA tax claims from it.
What remains: the SGIP Residential Solar and Storage Equity budget, $280 million with reservations open since June 2, 2025 for income-qualified households, at $3,100 per kW for solar and $1,100 per kWh for storage. DAC-SASH runs through 2030 for CARE or FERA customers in top-quartile CalEnviroScreen communities. The property tax new construction exclusion keeps a qualifying system from raising your assessed value, but it is scheduled to sunset January 1, 2027, which puts a real date on procrastination. And if an HOA hesitates, Civil Code 714 voids restrictions that add more than $1,000 of cost or cut efficiency more than 10 percent, and deems applications approved after 45 days of silence. We found no San Marcos city rebate this session.
The local installer snapshot
The map results around San Marcos mix small local outfits with large north county operations based in Escondido and Vista. Review counts range from single digits to several thousand, which tells you more about company size than quality. Whoever bids, make them state the CEA versus bundled SDG&E assumption in writing and show the $120 permit as a line item.
Precision Solar
San Marcos, CA
3.7(9 Google reviews)
SolarSun PowerPros San Marcos
San Marcos, CA
5.0(2 Google reviews)
Ratings snapshot: Google Maps, August 2026, via the DataForSEO SERP feed. Zero companies paid us and none are endorsed by us.
Screen your own numbers first
This tool runs the state average rate against our San Marcos production model. Because SDG&E territory prices sit well above the state average, consider its output conservative for self-consumed energy, and remember it cannot model CEA generation charges or hourly export values.
The upper bound is our San Marcos PVGIS run at 1,732 kWh per installed kW. The lower bound is 85 percent of that, a sanity margin for shade and off-south roof planes, not a site survey.
Cash quotes in San Marcos cluster near $2.46 per watt, against a $3.50 national 2024 median (LBNL). Use your quote.
Assumptions you can change
Use the rate on your actual lease or PPA quote. There is no published statewide average we trust enough to hardcode.
Cash purchase
$8,364 after state credit
- Year 1 benefit
- $163/mo
- Payback
- 5 years
- 20 year net position
- $39,152
San Marcos runs on SDG&E delivery with Clean Energy Alliance generation for most households. The calculator's state average rate understates SDG&E's 43.6 cent 2024 residential average, so the cash case here is usually stronger than the number on screen.
Solar loan
$112/mo 15 yr payment
- Year 1 net
- $51/mo
- Upfront
- $0
- 20 year net position
- $27,383
Financing against SDG&E level bills can still pencil, but insist on seeing the cash price, the financed price, and any dealer fee on separate lines before comparing either one to your CEA plus SDG&E bill.
Lease / PPA
$0 down you buy the power
- Year 1 net
- $45/mo
- Upfront
- $0
- 20 year net position
- $14,867
A lease or PPA provider prices its own tax position into your rate. Whatever it claims, the monthly payment has to beat a bill that is split between Clean Energy Alliance generation and SDG&E delivery, so ask which half the quoted savings come from.
Estimates, not quotes. Inputs use the California average retail rate, our downtown San Marcos PVGIS run and state market cost data. The tool cannot split Clean Energy Alliance generation from SDG&E delivery charges or model hourly Net Billing Tariff export values. We are a solar installer and we also partner with other solar companies. See our disclosures.
We are a solar installer and we also partner with other solar companies.
San Marcos questions we actually get
Am I a Clean Energy Alliance customer or an SDG&E customer?
What does a solar permit cost in San Marcos?
How fast is the permit itself?
Do San Marcos exports get the ACC Plus adder?
Is there still a federal tax credit in 2026?
Document trail
Primary sources behind every claim on this page, reviewed August 27, 2026.
- City of San Marcos solar permits, Development Services fee schedule (3/3/2025), and legacy counter hours page
- Clean Energy Alliance launch announcement and CEA member cities
- SDG&E pricing plans, TOU-DR1 total rates (1/1/2026), and EIA Table 6
- CPUC Net Billing Tariff, Decision 22-12-056, and SCE index of communities served
- Government Code 65850.52, Government Code 66015, Civil Code 714, and the CEC permitting tracker
- CPUC SGIP, DAC-SASH, BOE property tax exclusion, and CRS IN12611
- DOF E-5 housing estimates, San Marcos overview, and PVGIS
Get a San Marcos estimate that names your generation provider
Start from your bill and roof, then make every installer reconcile against the same production model.
What does your monthly electric bill look like?
San Marcos average is $161 per month (EIA, 2024).