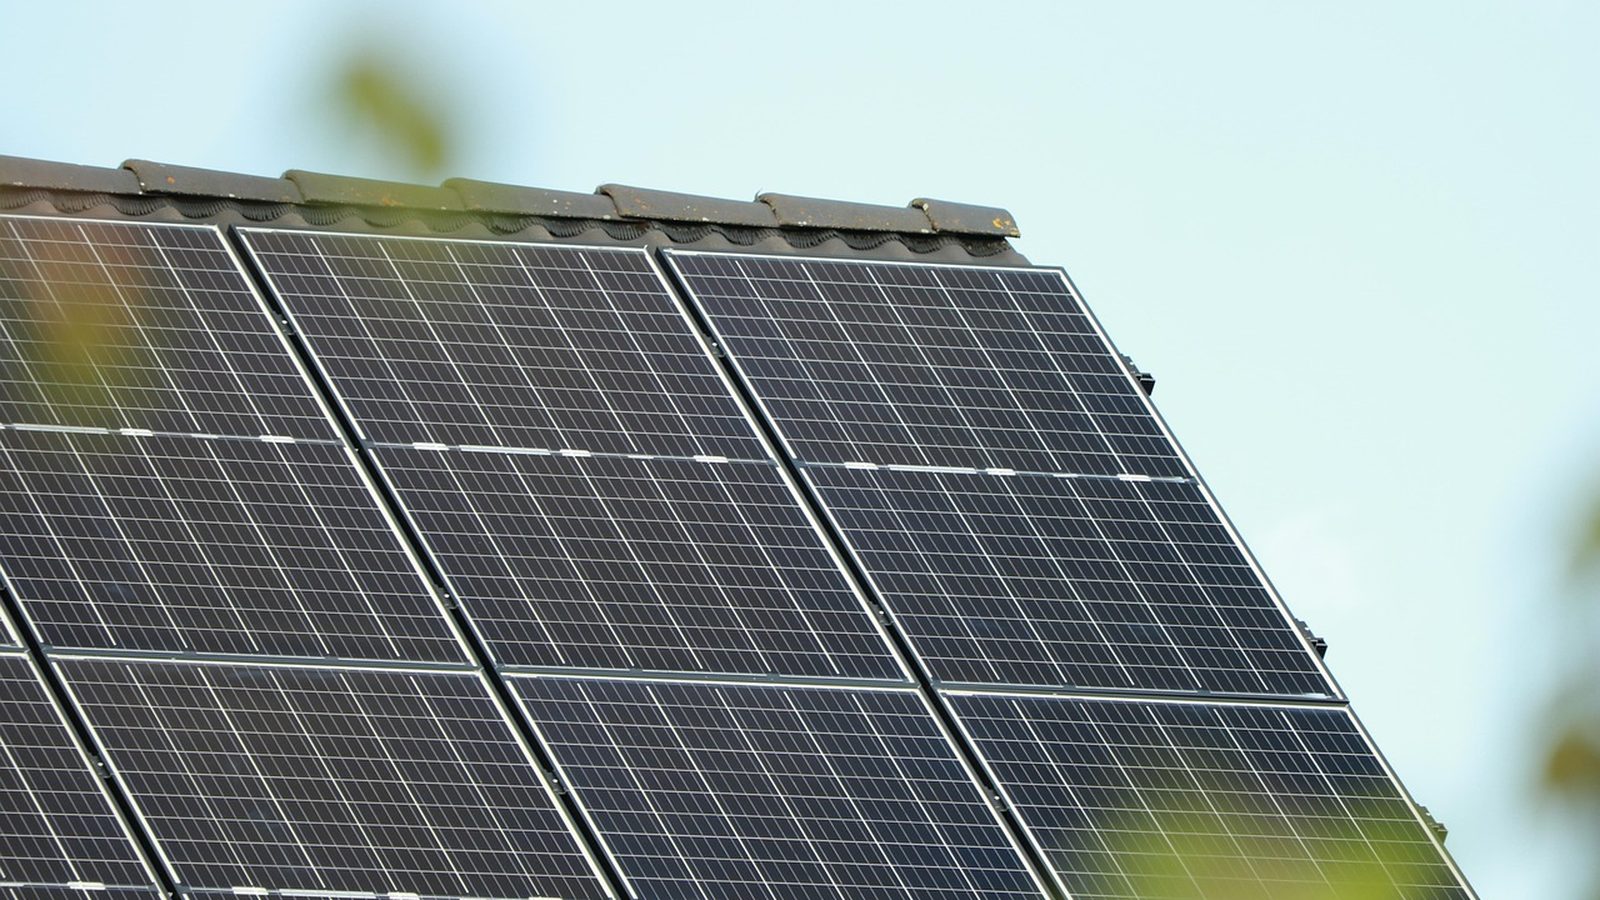
Photo: Caniceus, via Pixabay
California · San Ramon
San Ramon solar: MCE quietly raises every export by 10 percent
Written by the Solar Learning Lab research deskUpdated August 28, 202611 min read
Cross the county line from Alameda into Contra Costa and the generation provider changes without anyone mentioning it. San Ramon's power supply comes from MCE, not the Ava Community Energy that serves Livermore and San Leandro, and the difference is worth actual money to a solar household: MCE's Solar Bonus Credit adds a flat 10 percent on top of every Energy Export Credit its Solar Billing Plan customers earn. Not peak hours only. Not certain seasons. Every export, all year.
The city's permitting record has its own distinction. San Ramon stood up its SolarAPP+ platform without taking the state's CalAPP grant money, then filed its 2024 annual report anyway, the only city in our research batch to meet the SB 379 mandate self-funded. There is a catch for contractors, an extra onboarding step most SolarAPP+ cities skip, and a fee schedule with two different PV lines that quote different prices. All of it below.
Know your numbers before the knock
Run the estimator so a San Ramon proposal has to beat your baseline, not create it.
Estimate San Ramon solarMCE supplies the power. PG&E still owns everything you can touch.
San Ramon has been an MCE member community since 2018, one of 38 across Contra Costa, Marin, Napa, and Solano counties, with about 9,000 customer accounts locally per MCE's service area page. The split works like every California CCA: MCE procures generation, PG&E delivers it, meters it, bills it, and answers the phone during outages, per PG&E's CCA overview.
MCE's product lineup runs greener than the incumbent. Light Green has carried a minimum 60 percent renewable content since 2017, with the 2024 power mix showing 69 percent eligible renewables, against 23 percent in PG&E's 2024 mix, per MCE's energy sources page. Deep Green is the 100 percent renewable tier, half solar and half wind in 2024. The city government has bought Deep Green for municipal accounts since 2018, while about 6 percent of local customers have opted up. If a proposal leans on green virtue, remember the baseline here is already fairly clean; the solar case should stand on rates.
And the rates carry the argument fine. EIA's Table 6 shows a 2024 PG&E bundled residential average of 39.6 cents per kWh, and the March 2026 sheet prices the E-ELEC summer peak at 55 cents from 4 to 9 p.m. Those are the purchases a San Ramon roof gets to avoid.
The Solar Billing Plan, with MCE's thumb on the scale
Since April 15, 2023, new interconnections statewide fall under the CPUC's Net Billing Tariff. MCE's version, its Solar Billing Plan, applies to customers whose permission to operate application came after April 14, 2023 or whose 20 year legacy NEM period expired. All SBP customers were moved to the E-ELEC rate, billing settles monthly, and the annual cash out runs April to March.
| Energy source | Type | Average price | What that means |
|---|---|---|---|
| PG&E E-ELEC summer | import price, required rate | 33¢ to 55¢ per kWh | The 4 to 9 p.m. block is 55¢; winter spans 28¢ to 32¢. |
| MCE Solar Bonus Credit | flat multiplier on exports | +10% on all Energy Export Credits | Applies to every SBP export, every hour, unlike Ava's time-windowed bonus next door. |
| State export bonus, 2026 enrollment | vintage-locked adder | 0.9¢ / 3.6¢ per kWh, standard / income qualified | 2027 enrollment drops to 0.4¢ and 1.8¢. CARE and FERA customers also get an extra 5¢ MCE Solar Credit per exported kWh. |
| Self-consumed solar | avoided E-ELEC purchase | up to 55¢ per kWh at summer peak | The bonus helps, but avoided peak purchases still dwarf export credits. Size to your load. |
PG&E March 2026 rate sheet and MCE Solar Billing Plan page. A snapshot of published values, not a bill model.
Why does the flat 10 percent matter more than it sounds? Because it multiplies whatever the hourly export value happens to be, including the valuable early-evening hours, without asking you to chase a bonus window. Stack it with the state's vintage-locked export bonus, 0.9 cents per kWh for standard residential customers enrolling in 2026 versus 0.4 in 2027 per MCE's published schedule, and the timing math tilts toward sooner. For CARE and FERA households the stack gets steep: the 10 percent bonus, a 3.6 cent state bonus, and MCE's additional 5 cent Solar Credit on every exported kWh.
Read the fee schedule twice: $566 on one line, $450 on another
San Ramon's Master Fee Schedule for FY 2026 to 2027 contains a quirk we have not seen elsewhere. The standard residential photovoltaic line reads $566 for an installation of "10kWth or less" plus $17 per additional kWth, printed in thermal units for what are photovoltaic permits, and it sits north of the $450 base figure in Government Code 66015. A separate line, "SolarAPP+ Permit Designs," charges exactly $450. Same city, same roof, $116 apart depending on which lane your project takes. Contractors quoting permit costs should say which line they mean.
Getting into the cheaper automated lane takes more than SolarAPP+ registration. Per the city's SolarAPP+ program page, a contractor must also email PermitCenter@sanramon.ca.gov to join the city's program eligibility list, hold an active San Ramon business license, and return the signed permit card after issuance. That eligibility-list step is unique among the SolarAPP+ cities we researched this week; an installer who has never done a San Ramon job may not know the inbox exists.
The city's compliance record backs the process up. The CEC's tracking dataset shows San Ramon on the SolarAPP+ platform with 2024 data filed and CalAPP funding marked "Not Awarded." Every other city in our batch took the $60,000 grant. San Ramon met the Government Code 65850.52 mandate on its own dime and still does the paperwork, which tells you something about how the Building and Safety Division runs. Non-automated projects follow the standard submittal instructions: plot plan, installation details, and structural calculations when the system exceeds 5 pounds per square foot.
Production runs within a rounding error of the region's best
Our PVGIS model gives downtown San Ramon 1,672.6 kWh per year per installed kilowatt, essentially tied with Livermore for the top of our five-city NorCal set, two tenths of a kilowatt-hour apart. July models at 177.2 kWh per kW, the single highest monthly figure in the batch, and December holds a respectable 88.9. The 680 corridor's valley climate earns its reputation.
July models at 177.2 kWh per kW, the strongest single month in our five-city NorCal run. E-ELEC's 55 cent window makes those afternoons doubly valuable.
PVGIS v5.2 model run by Solar Learning Lab on August 28, 2026, NSRDB radiation database. Fixed south facing mount, 30 degree tilt, 14 percent losses, downtown San Ramon coordinates. Your roof will differ. The model lives at PVGIS. It benchmarks the location, not your roof. San Ramon's hillside lots and mature landscaping can carve real losses out of a theoretical run, which is why the estimate below carries a 15 percent sensitivity floor.
MCE writes batteries a small monthly check
Beyond the export bonus, MCE's Solar Storage Credit pays $10 per month for batteries under 20 kWh and $20 per month for 20 kWh and larger, just for having enrolled storage on the Solar Billing Plan. Pair that with the permitting side, where the fee schedule prices a first residential energy storage unit at $396 and each additional unit at $35, and San Ramon has one of the more legible battery propositions we have documented: known permit cost, known monthly credit, and an E-ELEC peak worth 55 cents to shift into.
The rest of the 2026 incentive picture is the statewide story. The 25D homeowner credit is gone for any system whose installation wrapped after December 31, 2025, per the CRS note, so nobody should be pricing phantom federal money into a cash quote. SGIP's equity budget pays income-qualified households $3,100 for every solar kW and $1,100 for every storage kWh. The property tax exclusion lasts through fiscal 2025 to 2026, then sunsets January 1, 2027. And Civil Code 714 boxes in HOA review, relevant in a city with plenty of planned communities: written denials, a 45 day deemed-approval clock, and no conditions that pile on more than $1,000 in cost or trim output beyond 10 percent.
One market note without a dollar figure attached: the state's E-5 estimates put San Ramon's vacancy at 2.40 percent, the tightest in our batch, with 61.8 percent of units single detached. People stay put here, which lengthens the horizon over which a solar investment gets to pay for itself.
The vendor field mixes installers with a watchdog
The San Ramon results include national names, local outfits, and, unusually, a consultancy whose entire business is reviewing other companies' solar bills. Read that as a signal about this market: enough solar has been sold along the 680 corridor that auditing it became a job. Your screen for any bidder: are they on the city's SolarAPP+ eligibility list, do they hold a San Ramon business license, and does their proposal model MCE's Solar Billing Plan rather than generic PG&E net billing. Three questions, and the pretenders exit early.

SunPower
San Ramon, CA
3.6(405 Google reviews)
Sky Power Solar
San Ramon, CA
4.1(15 Google reviews)
SolarForLife San Ramon
San Ramon, CA
5.0(1 Google reviews)

NorthStar Solar Inc
Danville, CA
4.7(50 Google reviews)
Solar Bill Review
Dublin, CA
4.9(132 Google reviews)
Ratings snapshot: Google Maps, August 2026, via the DataForSEO SERP feed. Zero companies paid us and none are endorsed by us.
Pressure-test the proposal
The estimator pairs our San Ramon production model with statewide average pricing and cost assumptions. MCE's 10 percent bonus and monthly storage credits are not in it, so a real MCE bill model should modestly beat this tool on the export side. If a salesperson's number beats it by a mile, the gap is assumptions, and you should ask for them in writing.
The upper slider bound is our San Ramon PVGIS run. The lower bound takes 15 percent off, a buffer for shade from the valley's mature landscaping or a roof plane that faces the wrong way.
Cash quotes in San Ramon cluster near $2.46 per watt, against a $3.50 national 2024 median (LBNL). Use your quote.
Assumptions you can change
Use the rate on your actual lease or PPA quote. There is no published statewide average we trust enough to hardcode.
Cash purchase
$8,610 after state credit
- Year 1 benefit
- $162/mo
- Payback
- 5 years
- 20 year net position
- $38,626
San Ramon runs on PG&E wires with MCE supplying generation, and MCE stacks a flat 10 percent Solar Bonus Credit on top of every export credit. None of that lives inside this calculator, which leans on a state average rate, so use it for sizing, not for forecasting a true up.
Solar loan
$115/mo 15 yr payment
- Year 1 net
- $47/mo
- Upfront
- $0
- 20 year net position
- $26,511
The financed figure includes the loan-over-cash spread that dealer fees create. A San Ramon bidder should hand you the cash price, the loan price, the APR, and the prepayment terms as four separate facts, not one monthly payment.
Lease / PPA
$0 down you buy the power
- Year 1 net
- $45/mo
- Upfront
- $0
- 20 year net position
- $14,779
Installs completed after December 31, 2025 get no 25D homeowner credit, so third party ownership in San Ramon is a pure rate bet: the contract price per kWh against your blended PG&E and MCE cost over decades. Model the escalator before you admire the year one number.
Estimates, not quotes. The tool uses the California average retail rate, our downtown San Ramon PVGIS run, and state market cost inputs. It cannot see MCE's 10 percent Solar Bonus Credit, hourly export values, or your panel layout. We are a solar installer and we also partner with other solar companies. See our disclosures.
We are a solar installer and we also partner with other solar companies.
Asked about San Ramon solar
Who actually supplies my electricity in San Ramon?
What is the MCE Solar Bonus Credit worth?
Why do I see two different permit fees?
Can any SolarAPP+ contractor pull an instant permit here?
Does a battery pay for itself faster in San Ramon?
Is there still a federal tax credit if I buy in 2026?
Citations drawer
Every claim above traces back to one of these records, checked August 28, 2026.
- San Ramon SolarAPP+ program page and residential PV submittal instructions
- San Ramon Master Fee Schedule, FY 2026 to 2027 and Government Code 66015
- MCE service areas, MCE Solar Billing Plan, and MCE energy sources
- PG&E CCA overview, PG&E rate pricing, CPUC Net Billing Tariff, and ACC Plus resolution
- CEC permitting dataset and Government Code 65850.52
- CPUC SGIP, CRS IN12611, BOE property tax exclusion, and Civil Code 714
- EIA Table 6, California DOF E-5 estimates, and PVGIS
Price a San Ramon system on MCE terms
Bring a bill, note whether you are on Light Green or Deep Green, and make the export assumptions earn their place in any quote.
What does your monthly electric bill look like?
San Ramon average is $161 per month (EIA, 2024).