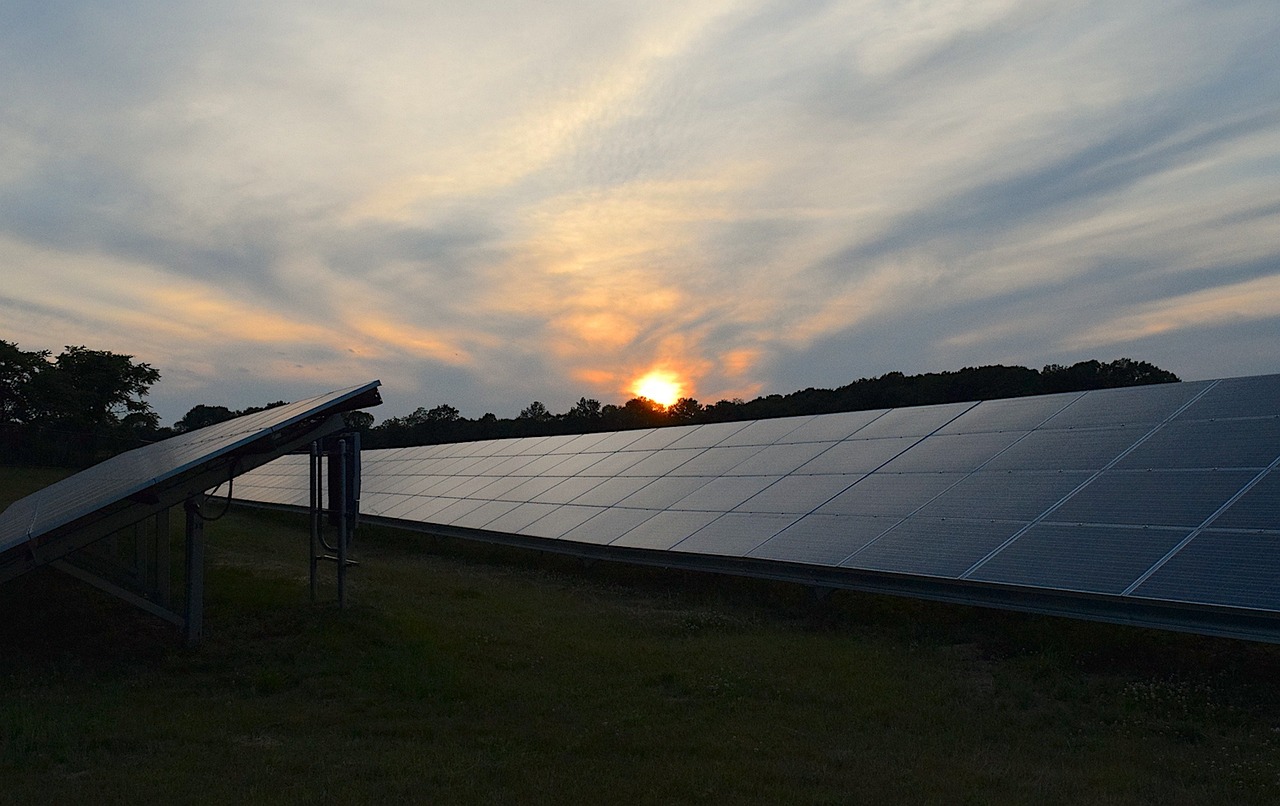
Photo: bones64, via Pixabay
California · Sunnyvale
Solar in Sunnyvale: large bills, less export sugar
Written by the Solar Learning Lab research deskUpdated August 23, 202610 min read
Sunnyvale is not an electricity-burden story. Santa Clara County's median census-tract energy burden is 1.15 percent of income, lower than the comparison counties in our research. But the city's $181,862 median household income does not make a large absolute PG&E bill imaginary. It changes what solar should be compared against. The CEC affordability file points to that distinction.
There is another correction to make before signing anything: Silicon Valley Clean Energy is cutting its non-CARE and non-FERA net-surplus multiplier from 2 times to 1 time after the March-April 2026 cycle. A proposal that still presents the old multiplier as a durable benefit is already behind the program.
Check the bill, then the export assumption
Use the estimate to test size. Then make every bidder show the value it assigns to onsite use and exports.
Estimate Sunnyvale solarSunnyvale has high absolute bills, not a high energy burden
It is tempting to call any expensive electric market an affordability crisis. That does not fit the evidence here. The CEC dataset puts Santa Clara County's median energy burden at 1.15 percent of income, including 1.11 percent for owners and 1.28 percent for renters. It is the lowest of the three county figures examined. Review the CEC data.
That does not make solar irrelevant. PG&E's 2024 bundled residential average was 39.617872 cents per kWh, and high-income households can still have big bills from larger homes, pools, EV charging, air conditioning and electric appliances. The honest case is bill management, not hardship theater. PG&E's current pricing sheet shows why time of use still matters.
Sunnyvale's housing mix makes site-specific judgment important too. Only 43.8 percent of occupied homes are owner-occupied, and 46.5 percent are single-family. A high income figure does not turn a renter's apartment into a rooftop project.
SVCE is changing the export benefit. Read the date.
Silicon Valley Clean Energy is the default generation provider in Sunnyvale and PG&E retains delivery. SVCE's E-1 generation rate is 8.006 cents per kWh, while its published E-ELEC generation rate changes by season and period. The January 2026 SVCE residential sheet shows the split.
| Energy source | Type | Average price | What that means |
|---|---|---|---|
| SVCE E-1 | generation | 8.006¢ per kWh | PG&E delivery remains on the bill. |
| PG&E E-ELEC | Solar Billing Plan rate | 28¢ to 55¢ per kWh | Time and season change the retail price. |
| SVCE solar bill credit | special summer credit | $50 bill credit | Transferred into the customer NEM or Solar Billing Plan credit balance. |
| Onsite solar | used at home | retail purchase avoided varies by time | Net surplus and exported energy have separate treatment. |
SVCE's rate sheet and SVCE solar program material. This is not a monthly bill forecast.
SVCE's annual net-surplus rate is a rolling average of PG&E DLAP prices from 7 a.m. to 5 p.m. over April through March, typically 2.5 to 3 cents per kWh. Historically, non-CARE and non-FERA customers received 2 times that rate. After the March-April 2026 cycle, they receive 1 time. CARE and FERA customers retain a 2.5 multiplier. SVCE's 2026 resolution has the exact policy change.
That multiplier is a net-surplus settlement feature, not a broad promise for every exported kWh. New systems still operate under the Solar Billing Plan, where credits vary and onsite use is the part of the economics you control. The CPUC overview explains why export credit differs from a retail purchase.
The permit can be instant. The complete project cannot.
Sunnyvale lets eligible licensed contractors obtain instantaneous rooftop solar permits through SolarAPP+ and then upload the documents into E-OneStop. The City lists a $25 SolarAPP+ processing fee. Sunnyvale's SolarAPP+ instructions are unusually clear.
The FY 2026-27 proposed fee schedule lists a $388 residential photovoltaic permit fee, a $42.50 permit issuance fee and a 5 percent technology surcharge. The cited Council item was scheduled for adoption June 16, 2026, with most fees effective July 1. Confirm the total being charged for your application rather than adding a stale fee line to the contract. The City's fee document is the source.
Instant plan approval does not erase utility permission to operate, inspection scheduling, a panel upgrade or a site correction. It just removes one common wait for eligible designs. That is better, not magical.
The roof model is strong. The load profile still wins.
Our downtown Sunnyvale model produces 1,683.8 kWh per installed kW annually. July is the high month at 177.0 kWh per kW; December is 90.7. This is a standardized comparison point, not a production guarantee for a tree-lined lot or a complicated roof.
July is the modeled high month at 177.0 kWh per kW. The project value depends on the solar you use, not only the solar you make.
PVGIS v5.2 model run by Solar Learning Lab on August 23, 2026, NSRDB radiation database. Fixed south facing mount, 30 degree tilt, 14 percent losses, downtown Sunnyvale coordinates. Your roof will differ. The city-level benchmark comes from PVGIS. A bid should reconcile it to the roof plane, shade and actual hourly consumption before claiming a percentage bill reduction.
Make the project fit the household you actually have
A good Sunnyvale solar design begins with the present load, then explicitly identifies future loads. Ask whether the quote assumes an EV, heat pump, pool or home office that does not yet exist. If it does, ask when it arrives and what happens to the economics if it does not.
About 42.6 percent of occupied local homes use electricity as their main heating fuel. That is a real source of electric load for some homes, but the citywide figure cannot describe your own equipment or schedule. Census heating data is a prompt to inspect the bill, not a reason to guess.
The federal homeowner 25D credit ended for installations completed after December 31, 2025. In 2026, the cash price needs to stand on its own. CRS guidance gives the timing rule.
Compare the modeling, not just the system size
Tell each bidder upfront that SVCE's non-income-qualified multiplier changed after the March-April 2026 cycle. Then ask them to show exactly where that policy appears in their savings model. The right answer is a line item and a date. Not a vague assurance that the company “uses current utility rates.”


TN Electrical and Solar Services
Milpitas, CA
5.0(121 Google reviews)
Highlight Solar
San Jose, CA
4.8(60 Google reviews)
Evolution Solar inc
Santa Clara, CA
4.6(22 Google reviews)
Ratings snapshot: Google Maps, August 2026, via the DataForSEO SERP feed. Zero companies paid us and none are endorsed by us.
Also compare cash price, roof scope, electrical scope and annual production on the same basis. The smallest quote is not automatically the cheapest project if it assumes a risky roof or invents export value.
Use this as a screen, not a SVCE bill simulator
The calculator can compare sizes and test a conservative production range. It cannot reproduce SVCE settlement mechanics, PG&E delivery charges or the value of each export interval. That limitation matters here.
The upper end is the downtown Sunnyvale PVGIS output. The lower end is 85 percent of it, a sensitivity check for a less favorable roof, not an output promise.
Cash quotes in Sunnyvale cluster near $2.46 per watt, against a $3.50 national 2024 median (LBNL). Use your quote.
Assumptions you can change
Use the rate on your actual lease or PPA quote. There is no published statewide average we trust enough to hardcode.
Cash purchase
$8,610 after state credit
- Year 1 benefit
- $163/mo
- Payback
- 5 years
- 20 year net position
- $38,942
This is a screening estimate using California market inputs and a Sunnyvale production model. SVCE generation, PG&E delivery, time-varying Solar Billing Plan credits, fixed charges and your roof may produce a different bill result.
Solar loan
$115/mo 15 yr payment
- Year 1 net
- $48/mo
- Upfront
- $0
- 20 year net position
- $26,827
Request cash price, financed price, dealer fee, APR and prepayment terms separately. Do not compare a loan payment with a pre-solar bill and call the gap savings.
Lease / PPA
$0 down you buy the power
- Year 1 net
- $45/mo
- Upfront
- $0
- 20 year net position
- $14,878
Compare a lease or PPA's payment and escalator against the expected post-solar bill. The value here comes from the load you use on site, not from a multiplier that has changed.
Estimates, not quotes. This tool uses California average retail-rate and market-cost inputs plus a Sunnyvale PVGIS production run. It cannot reproduce SVCE export treatment, PG&E charges, fixed charges, shading or your billing history. We are a solar installer and we also partner with other solar companies. See our disclosures.
We are a solar installer and we also partner with other solar companies.
Sunnyvale solar questions
Is Sunnyvale a high electricity-burden city?
Who supplies Sunnyvale electricity?
What changed in the SVCE export multiplier?
Can Sunnyvale solar permits be instant?
What is the SolarAPP+ fee in Sunnyvale?
Sunnyvale document trail
Every operational claim above was checked against these pages on August 23, 2026.
Document trail: City SolarAPP+ instructions, Sunnyvale fee document, SVCE rates, SVCE net-billing resolution, PG&E Solar Billing Plan, CPUC net billing guidance, CEC affordability dataset, PVGIS, and CRS tax-credit note.
Get a Sunnyvale estimate that shows the export assumption
Bring a year of bills and the future loads you actually expect. Make the math explain itself.
What does your monthly electric bill look like?
Sunnyvale average is $161 per month (EIA, 2024).