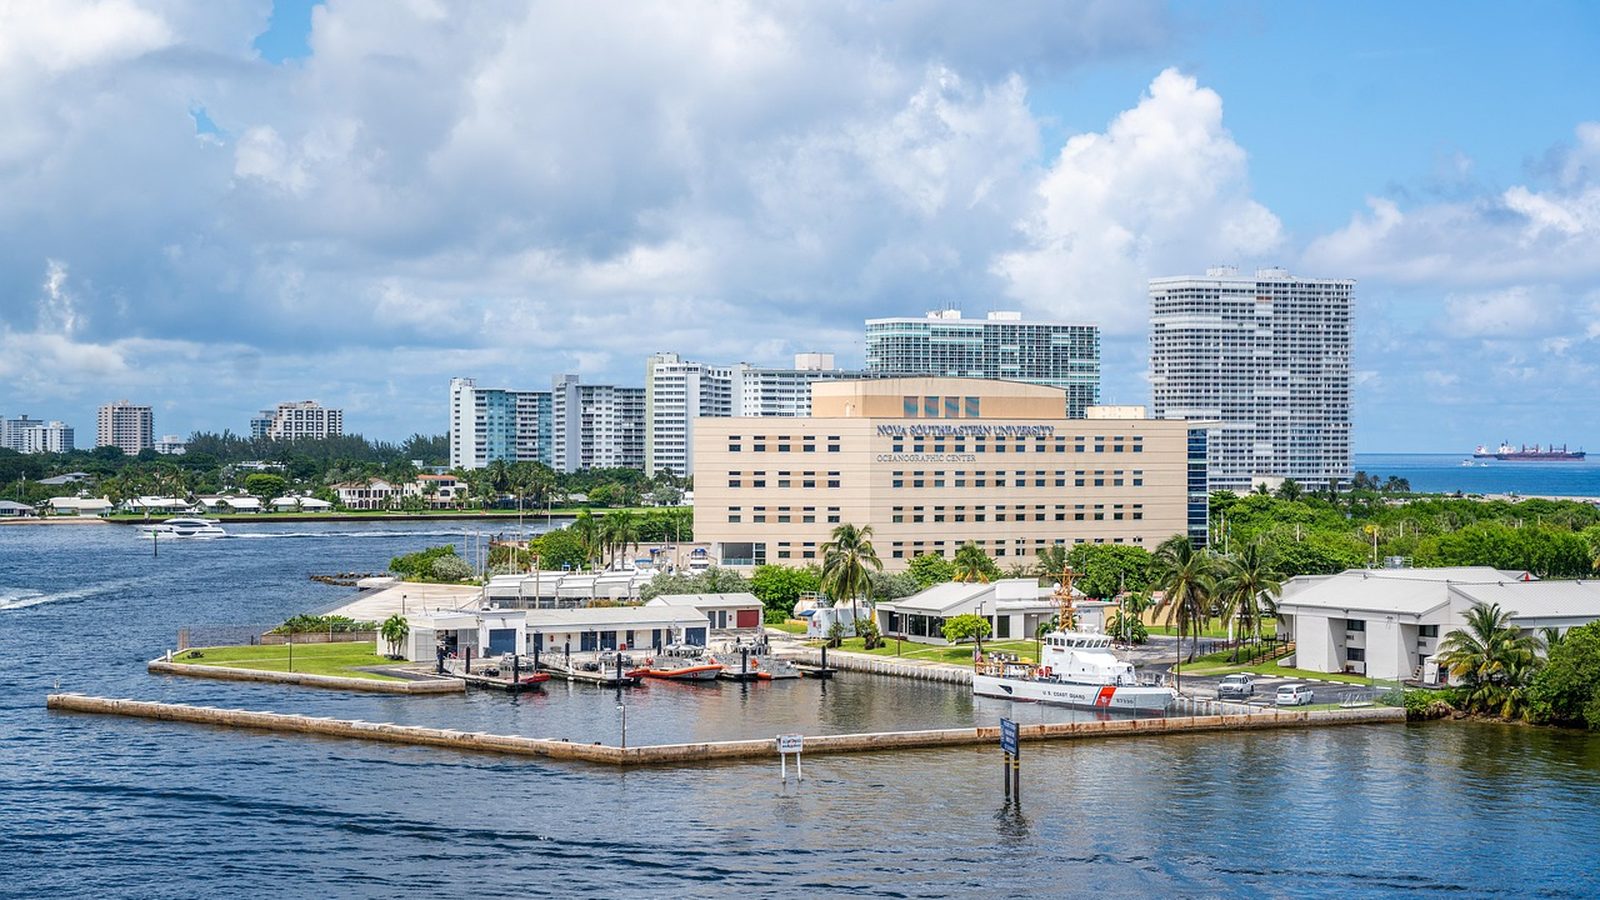
Photo: Michelle-Maria, via Pixabay
Florida · Fort Lauderdale
Fort Lauderdale solar: the payback FPL's rulebook actually permits
Written by the Solar Learning Lab research deskUpdated August 30, 202612 min read
The sales version of Fort Lauderdale solar is 3,000 hours of sunshine and a smiling payback slide. The regulatory version lives in Florida Administrative Code Rule 25-6.065, and it is worth reading before any contract, because two of its clauses quietly control when your system pays for itself. Clause one: netting happens monthly, with excess generation credited against the next month's bill. Clause two: credits can accumulate for up to twelve months, and whatever remains at the end of the calendar year gets bought out at an average annual rate based on FPL's COG-1 as-available energy tariff. As-available means what it sounds like: a wholesale figure, well under the retail rate your consumption offsets.
So a kWh you use yourself is worth retail, a kWh that rolls forward is worth retail eventually, and a kWh stranded past December is worth pennies on the retail dollar. The design consequence is unglamorous but decisive: match the array to the meter. The rule even says systems must be sized to offset part or all of the customer's electrical needs at that location. This page runs the whole Fort Lauderdale picture through that lens, from the 185 mph wind engineering Broward demands to the one portal every permit now flows through.
Payback starts with sizing discipline
Before anyone shows you a payback slide, bracket the system size your own consumption supports.
Bracket my system sizeMonthly netting is generous. The December true-up is not.
Give the rule its due first. Rule 25-6.065 requires every Florida investor owned utility to offer net metering to customer owned renewable generation, with bidirectional metering installed at no additional cost. Residential systems at 10 kW or less sit in Tier 1, and the gross power rating for inverter based systems is the DC rating times 0.85, a conversion factor that matters when a bid dances near the tier line. Within any month, exports offset imports; surplus becomes a credit on the following month's cycle. Through a Florida summer of afternoon thunderstorms and heavy air conditioning, that monthly rhythm works strongly in your favor.
The catch arrives with the new year. Unused credits get cashed out at the COG-1 based average, and the customer keeps paying applicable customer and demand charges throughout. In practice the households that hit their projected payback are the ones whose arrays chase their own consumption, which in this city is substantial: 90.2 percent of homes heat with electricity per Census ACS 2023 data, and cooling runs most of the year. The households that miss are the ones sold a bigger system on the theory that FPL would buy the difference. FPL will, once a year, at a price you would not have accepted in the showroom.
The leftover ledger: what surplus actually paid statewide
You do not have to take our word on the true-up being small money. The Florida PSC's 2023 net metering report counts 92,455 FPL interconnections carrying 876,218 kW of residential solar as of December 31, 2023, and shows FPL paying customers a combined $1,064,678 for unused annual credits. Statewide, 249,521 interconnections and 2,351,333 kW. Read those two FPL figures side by side: nearly a hundred thousand solar households, and roughly a million dollars of true-up money split among all of them for the year.
That is the empirical case for sizing to consumption, made with the utility's own ledger. The export check is a rounding error in aggregate, which means it should be a rounding error in your proposal too. If a payback model leans on year end payments to close, ask the bidder to rebuild it without them and watch what happens to the timeline.
A rate path with signatures on it through 2029
Fort Lauderdale pays some of the cheaper power in our coverage: FPL residential service averaged 13.71 cents per kWh in 2024 across 5,236,277 customers, per EIA Table 6. And unusually, the next few years are already mapped. On November 20, 2025 the Florida PSC approved FPL's four year rate agreement covering 2026 through 2029, with the typical 1,000 kWh bill rising about $2.50, roughly 2 percent, from $134.14 to $136.64 in January 2026, per the approval announcement.
| Energy source | Type | Average price | What that means |
|---|---|---|---|
| FPL | 2024 residential average | 13.71¢ per kWh | EIA Table 6 across 5,236,277 customers. Low by national coastal standards. |
| FPL | Typical 1,000 kWh bill, January 2026 | $136.64 per month | Up from $134.14 under the approved 2026 to 2029 rate agreement. |
| FPL | Original 2027 request, PSC estimate | $141.68 per month at 1,000 kWh | From the petition seeking $1.545 billion in 2026 and $927 million in 2027 base increases. |
| Your surplus after December | COG-1 as-available true-up | below retail average annual rate | Unused credits cash out at a wholesale derived figure, not the rate on the rows above. |
Rate agreement figures from the PSC approval release and the PSC's consumer report; average from EIA.
We will say the quiet part: nobody in this city needs solar to escape a runaway bill, and copy that pretends otherwise insults your intelligence. The Fort Lauderdale case is built from sunshine volume, tax treatment, and a known rate path that lets you model payback with fewer guesses than almost any market we cover.
The wind numbers your racking has to answer for
Broward County sits inside the Florida Building Code's High-Velocity Hurricane Zone, the strictest wind regime in American residential construction. The Florida Building Commission's ASCE 7-16 fact sheet assigns Broward a Risk Category IV ultimate design wind speed of 185 mph, with Miami-Dade at 195, and FBC Section 1620.2 spans 165 to 195 mph across the two counties by risk category while Section 1620.3 mandates Exposure Category C for the entire zone.
This is not paperwork trivia. Exposure C assumes open, wind-swept terrain for every structure in the zone, which pushes attachment schedules, fastener counts and edge zone details well past what an installer from Orlando considers normal. The city's recent hurricane record, Irma in 2017 after Katrina and Wilma both hit in 2005, is the argument made physical. When you compare bids, the racking engineering page is where Fort Lauderdale projects are won or lost, not the module brand.
One portal, one form, and a clock that runs both ways
Since January 1, 2024, every permit application in the city flows through LauderBuild, the Accela based portal behind the Lauderdale Paperless Review process, filed on the Broward County Uniform Permit Application. The Building Services Division works out of the Greg Brewton Center at 700 NW 19th Avenue; the Permit Solutions team answers at 954-828-3160, and phone hours run Monday to Friday, 8:00 am to 3:30 pm at 954-828-6520, option 1.
Two clocks worth knowing from the permitting services page. The building official examines applications within 30 days under Florida Building Code 105.3.1. And the clock runs against you too: an application goes abandoned 180 days after filing unless pursued in good faith. Simple jobs have a faster lane, with Walk-Thru applications processed the next business day between 8:00 and 9:30 am. No solar specific fee line appeared on any city page we fetched, so treat quoted permit costs as estimates until LauderBuild prices your actual submission.
Local receipts, not marketing slogans
Fort Lauderdale has receipts most Florida cities cannot produce. The city's Solar Power page cites its SolSmart Gold designation for streamlining rooftop solar and its participation in the Go SOLAR Broward Rooftop Solar Challenge alongside Broward County partners. And residents have organized before: the Broward 2023 Solar Co-op run by Solar United Neighbors, with the city among its listed partners, gathered 89 members who competitively selected Go Solar Power as their installer.
Why we bother listing these: a co-op's competitive selection process is a free education in what local pricing looks like when a group forces bids to compete, and a SolSmart Gold city has already sanded down the permitting friction that inflates soft costs elsewhere. Bring both facts up when you negotiate; they shift the conversation in your favor.
March beats June, and that is not a typo
Our downtown Fort Lauderdale run models 1,548.7 kWh per year per installed kW, with the peak in March at 149.3 kWh per kW and a June figure of just 118.5. A tropical rainforest climate delivering roughly 60.95 inches of rain, most of it June through September, flattens exactly the months that dominate production everywhere else. September is the modeled floor at 115.7.
March models 149.3 kWh per kW, the annual peak. Wet season cloud cover pulls June down to 118.5, a reversal of the usual solar calendar.
PVGIS v5.2 model run by Solar Learning Lab on August 30, 2026, NSRDB radiation database. Fixed south facing mount, 30 degree tilt, 14 percent losses, downtown Fort Lauderdale coordinates. Your roof will differ. Tool documentation at PVGIS. The flat, rain-dented curve is actually good news under monthly netting: production and air conditioning load track each other closely enough that a well sized system consumes most of its own output in the month it is made, which is precisely the behavior the true-up rules reward.
Two tax shields still standing in 2026
The federal side is finished: the 25D homeowner credit does not apply to expenditures after December 31, 2025, and completion date controls, so 2026 installations get nothing, per the Congressional Research Service. Florida never offered a state rebate or income credit to lose. What the state does offer are two shields that never expire on a calendar.
Florida Statute 193.624 bars the property appraiser from considering any increase in just value attributable to a renewable energy source device on residential property, for devices installed since January 1, 2013, and the covered list runs through PV panels, inverters, racks, wiring and batteries that store solar energy. Statute 212.08(7)(hh) exempts solar energy systems and their components from sales tax, with the Florida Solar Energy Center certifying what qualifies. On a canal city with a median household income of $79,935 and 53.8 percent owner occupancy per ACS 2023, those two shields are the entire incentive story, and they are enough to keep the math honest.
The Broward bench, including a marine wildcard
Our Fort Lauderdale pull surfaced five companies from Fort Lauderdale proper, Oakland Park and Hollywood, ratings from 4 to 4.9 stars, including one shop rooted in marine electronics, fitting for a city with 165 miles of canals and a yachting economy. National names appear here too, so ask every bidder the same questions and let the answers sort them.
ProSolar Florida
Oakland Park, FL
4.3(141 Google reviews)
Solar Construction LLC
Fort Lauderdale, FL
4.8(78 Google reviews)
eMarine Electronics & Power Systems
Fort Lauderdale, FL
4.3(75 Google reviews)

Solar Prime Usa
Hollywood, FL
4.9(45 Google reviews)
Ratings snapshot: Google Maps, August 2026, via the DataForSEO SERP feed. Zero companies paid us and none are endorsed by us.
The three screening questions for this market: show me your HVHZ attachment detail for a 185 mph Risk Category design, walk me through a LauderBuild submission you filed this year, and rebuild your payback model with zero true-up revenue. Two minutes of answers tells you who works Broward and who commutes to it.
Size it to the meter, then check the price
The estimator below runs the 13.71 cent 2024 FPL average against our Fort Lauderdale production model. By construction it values every kWh at retail, which is the correct assumption only when your system stays inside your consumption. Treat its most optimistic output as the ceiling that perfect sizing earns, and anything an installer promises beyond it as a claim that needs a paragraph of the tariff to back it up.
Ceiling: 1,548.7 kWh per kW, our downtown Fort Lauderdale PVGIS run. Floor: 15 percent below it. The summer wet season, not winter, is what pulls this city off its March peak.
Cash quotes in Fort Lauderdale cluster near $2.17 per watt, against a $3.50 national 2024 median (LBNL). Use your quote.
Assumptions you can change
Use the rate on your actual lease or PPA quote. There is no published statewide average we trust enough to hardcode.
Cash purchase
$19,096 after state credit
- Year 1 benefit
- $156/mo
- Payback
- 10 years
- 20 year net position
- $26,247
Florida offers no rebate and no state income tax credit. The Fort Lauderdale cash case rests on offsetting 13.71 cent FPL power at retail through monthly netting, equipment exempt from sales tax, and a system value the county appraiser must ignore.
Solar loan
$267/mo 15 yr payment
- Year 1 net
- -$111/mo
- Upfront
- $0
- 20 year net position
- -$2,638
Loan pricing uses the Florida EnergySage benchmark plus the LBNL dealer fee spread. In a high velocity hurricane zone, a loan term that outlives the roof underneath the array is a real underwriting question, not a footnote.
Lease / PPA
$0 down you buy the power
- Year 1 net
- -$117/mo
- Upfront
- $0
- 20 year net position
- -$30,217
The federal 25D homeowner credit ended for installations completed after December 31, 2025. Read any Fort Lauderdale lease for its escalator and for who keeps the year end true-up payment on surplus credits.
Estimates, not quotes. This tool runs the 2024 FPL average rate from EIA, our Fort Lauderdale PVGIS output and EnergySage Florida costs. It cannot model the COG-1 true-up on annual surplus, so an oversized system will look better here than it will on a real bill. We are a solar installer and we also partner with other solar companies. See our disclosures.
We are a solar installer and we also partner with other solar companies.
Straight answers, with the rule attached
Does FPL pay me retail for the power I export?
How big should a Fort Lauderdale system be?
What wind rating applies to my roof array?
How do I pull the permit?
What incentives are actually left?
Has group buying worked here before?
Paper trail
Every number above comes from these records, reviewed August 30, 2026. FPL's own site blocks automated review, so utility figures come from the PSC, EIA, Broward County and the approval release.
- FAC Rule 25-6.065 and the PSC 2023 net metering report
- FPL rate agreement approval release and PSC consumer report on the rate case
- LauderBuild, permitting services and the city's Solar Power page
- FBC ASCE 7-16 fact sheet and HVHZ wind load code text
- FS 193.624, FS 212.08, Broward 2023 Solar Co-op and Go SOLAR Broward
- FPL presentation to Broward County, EIA Table 6, city profile, PVGIS and CRS IN12611
Get a Fort Lauderdale design sized to your meter
Twelve months of bills beats any satellite estimate in this market. Bring them and the sizing conversation gets short and honest.
What does your monthly electric bill look like?
Fort Lauderdale average is $167 per month (EIA, 2024).