Skip to content
Solar Learning Lab
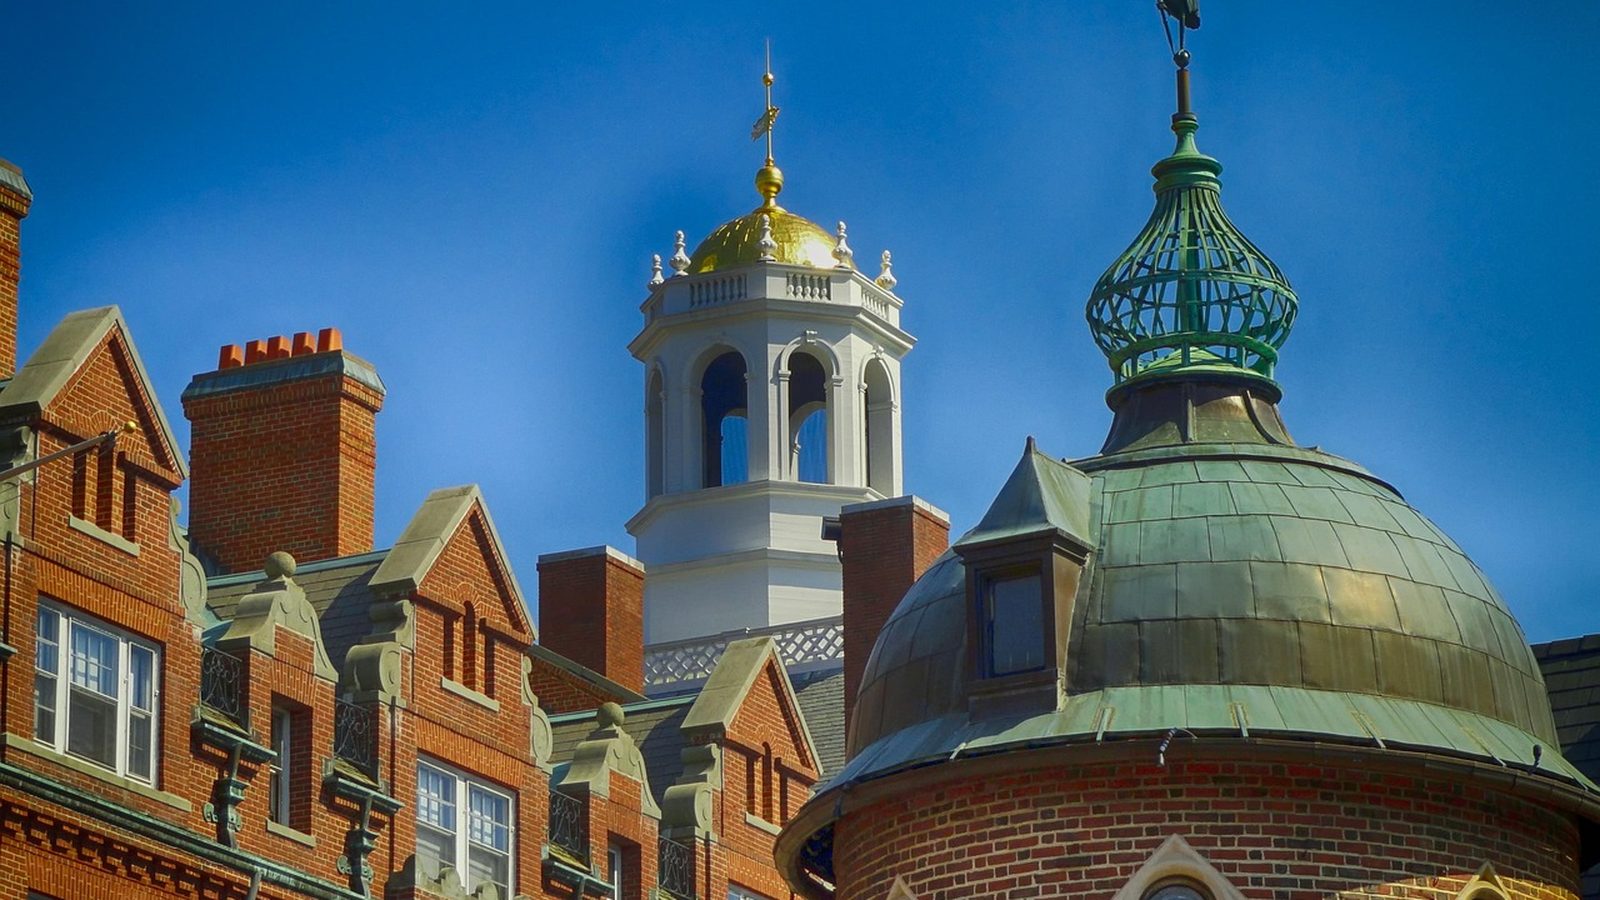
Harvard University architecture in Cambridge, Massachusetts

Photo: 12019, via Pixabay

massachusetts / Cambridge

Solar in Cambridge starts with a map, not a quote

Written by the Solar Learning Lab research deskUpdated September 1, 202612 min read

Cambridge rooftop projects clear three gates in order: the Historical Commission district map, two Inspectional Services permits, and Eversource interconnection. This page walks each gate with the city documents that govern it. PVGIS production source.

Price a Cambridge roof honestly

The calculator below uses the city PVGIS run and the 2024 utility average, not a sales deck.

Jump to the calculator

The map that sets your timeline

The first Cambridge question is not what panels cost. It is whether your address sits in one of the city's two Historic Districts or four Neighborhood Conservation Districts: Mid Cambridge, Half Crown-Marsh, Avon Hill, and Harvard Square. In those areas, Historical Commission staff review permit applications before Inspectional Services acts. That review is not automatically slow. Work not visible from any public way can receive a Certificate of Non-Applicability at staff level, one of three certificate types the Commission issues, and that is the practical fast lane for a rear facing array. The mistake people make is discovering the district boundary after the design is done. Check the address through the MyCambridge tool or call 617-349-4683 before anyone draws a layout. Ten minutes of map reading can save a redesign.

Source: Cambridge Historical Commission, districts and historic properties

Two permits at 831 Mass Ave

Cambridge routes solar through the standard process at the Inspectional Services Department, 831 Massachusetts Avenue, 617-349-6100, with 28 inspectors and support staff behind the counter. No automated solar platform exists here; applications go through the citywide Online Permitting System. Budget for both sides of the fee schedule. The building permit runs $15 per $1,000 of construction cost for three residential dwelling units or less, $50 minimum, against a standard rate of $20 per $1,000. The electrical side prices PV at $100 per array plus $10 per 100 amps. One more line matters: start work before the permit issues and the fee triples, under City Ordinance sections 15.04.010, 15.08, and 15.12. Counter hours changed effective January 1, 2026, with Monday open 7:00 a.m. to 6:00 p.m. and Friday closing at noon, so an installer who still quotes the old schedule has not been to the counter lately.

Sources: ISD, building fees, electrical wiring fees

Which rate does solar offset here

Cambridge is Eversource territory. The DPU's Electricity Providers by Municipality document lists the city under NSTAR Electric d/b/a Eversource Energy. But the supply line on most local bills is not Eversource basic service. Cambridge Community Electricity, the city aggregation launched in June 2017, automatically enrolls every residential and commercial account in its Standard Green plan unless the customer opted out, with Direct Energy holding fixed prices from January 2024 through December 2026. Meanwhile the filed NSTAR East fixed basic service rate for August 1, 2026 to January 31, 2027 is 17.323 cents per kWh, nearly 11 percent above the prior 15.629 cents. For the long view, the EIA 2024 average for NSTAR Electric residential customers came to 29.913775 cents per kWh all in. A savings pitch that quotes only one of these numbers without saying which supply you are on is not a model. It is a guess.

Sources: DPU territory list, Cambridge Community Electricity, EIA Table 6

The 68J credit, spelled out

Exported energy in Cambridge is settled under the Eversource net metering tariff, M.D.P.U. No. 68J, effective January 1, 2023. For a Class I solar facility, the Standard Net Metering Credit each billing period equals 100 percent of excess kWh multiplied by the sum of four rate components: the basic service charge in the customer's ISO-NE load zone, the distribution charge, the transmission charge, and the transition charge. The credit leaves out demand side management charges, renewable energy kWh charges, and the SMART factor. That is close to retail value, which is why Massachusetts export math still works. Size limits are generous for houses: Class I covers facilities of 60 kW or less, and anything at 25 kW or less nameplate is cap exempt under 220 CMR 18.02, so program cap status is not a residential problem. The governing regulations, 220 CMR 18.00, took their current form on December 20, 2024.

Sources: Eversource tariff 68J, mass.gov net metering guide

What survives in the 2026 stack

Start with the loss. The federal 25D homeowner credit ended for expenditures made after December 31, 2025, and the statute treats an expenditure as made when installation is completed, so a project finished in 2026 gets nothing even if it began in 2025. What remains is state machinery. SMART 3.0 pays small systems of 25 kW AC or less a flat 3 cents per kWh generated in Program Year 2026, and 6 cents for low income units; the DPU approved the program provisions without changes on May 19, 2026. The state income tax credit is 15 percent of net expenditure capped at $1,000, and that cap is lifetime per principal residence, claimed on Schedule EC. Equipment is sales tax exempt under G.L. c. 64H section 6(dd), and Clause 45 keeps a qualifying system off the property tax assessment. Batteries earn separately: ConnectedSolutions pays $275 per kW of average summer event contribution, up to roughly $1,375 a year for a 5 kW contribution, with events limited to June 1 through September 30, 3:00 p.m. to 8:00 p.m., up to 60 signals of at most three hours.

Sources: CRS on 25D, SMART 3.0, Schedule EC

A city of tenants and condo boards

Here is the demographic fact that shapes every Cambridge solar conversation: only 33.7 percent of households own their home, and just 16.4 percent of the housing stock is single family, per the US Census Bureau, ACS 5-year estimates, 2023. Median household income is high at $126,469, but income does not create roof authority. Much of the city is streetcar era multifamily housing, subdivided estates near Harvard, and industrial East Cambridge stock, so the decision maker is often a condo association or a landlord rather than the person reading this page. For larger buildings the city built a specific on ramp: the Cambridge Solar Assistance Program, announced April 2025, gives no cost support through Resonant Energy to owners of commercial and large residential buildings with at least 25 kW of potential and roofs under 10 years old, offering direct purchase, PPA, and solar hosting models. If you own a two or three unit building outright, you hold the rare Cambridge advantage: full roof authority plus the cheaper $15 per $1,000 residential permit rate.

Sources: US Census Bureau, ACS 5-year estimates, 2023, city program announcement
The Cambridge production model

Our downtown Cambridge run totals 1350 kWh per kW per year, with July the strongest month at 139.8 kWh per kW and December the weakest at 68.5. Treat the curve as a location model, not a roof promise.

Jan
Feb
Mar
Apr
May
Jun
Jul
Aug
Sep
Oct
Nov
Dec

A shaded urban lot or a flat roof ballast system will bend this curve.

PVGIS. PVGIS v5.2 NSRDB, run by Solar Learning Lab on August 31, 2026, 30 degree tilt, 14 percent losses, downtown coordinates. Your roof will differ.

Energy sourceTypeAverage priceWhat that means
Eversource MA (NSTAR)Residential electricity29.91¢ calculator benchmarkEIA Table 6, 2024 utility bundled retail sales, NSTAR Electric residential average
CambridgePVGIS output1350 kWh per kW annuallyFixed south facing model; individual roofs differ.

The benchmark is a 2024 utility average, not your current supply line. Read the supply section above first.

Companies working this market

Interview candidates on Cambridge specifics: ask which certificate they expect from the Historical Commission, what the two ISD permits will cost on your building, and which supply rate their savings model assumes. Weak answers to those three questions predict weak project management later.

Ratings snapshot: Google Maps, August 2026, via the DataForSEO SERP feed. Zero companies paid us and none are endorsed by us.

EnergySage

Boston, MA

4.8(1,031 Google reviews)

Solstice logo

Solstice

Cambridge, MA

4.8(74 Google reviews)

Brightway Energy logo

Brightway Energy

Somerville, MA

4.9(40 Google reviews)

Terawatt

5.0(16 Google reviews)

Resonant Energy logo

Resonant Energy

Boston, MA

5.0(10 Google reviews)

Ratings and review counts are Google Maps ratings for Cambridge local results, retrieved August 17, 2026 via the DataForSEO SERP API. We list the highest rated established companies we found. No company paid to appear here, and appearing here is not an endorsement. Check current reviews and licensing before you sign anything.

Run the Cambridge numbers

$167
1,350

The upper bound is the downtown Cambridge PVGIS run at 1,350 kWh per kW. The lower bound holds back 15 percent as planning slack; it is not a shade study.

$3.50

Cash quotes in Cambridge cluster near $3.50 per watt, against a $3.50 national 2024 median (LBNL). Use your quote.

Assumptions you can change
2.5%
7%
15
24c

Use the rate on your actual lease or PPA quote. There is no published statewide average we trust enough to hardcode.

2%
Estimated system: 5 kWAnnual usage: 6,700 kWhState credit: $1,000

Cash purchase

$16,500 after state credit

Year 1 benefit
$185/mo
Payback
8 years
20 year net position
$36,357

Many Cambridge accounts buy supply through Cambridge Community Electricity at a fixed Direct Energy price through December 2026, so check which supply line your savings actually offset.

Solar loan

$202/mo 15 yr payment

Year 1 net
-$17/mo
Upfront
$0
20 year net position
$16,454

Loan figures carry the Massachusetts statewide financing input. A Cambridge quote should price the historic review step and both city permits before the loan term is set.

Lease / PPA

$0 down you buy the power

Year 1 net
$33/mo
Upfront
$0
20 year net position
$11,570

Under any third party contract, confirm in writing who keeps SMART payments and net metering credits, and how the contract rate compares with your aggregation supply price.

Estimates, not quotes. Inputs use the 2024 EIA utility average for NSTAR Electric, our Cambridge PVGIS run, and state cost benchmarks. Historic district review, permits, roof condition, and utility approval are not modeled. We are a solar installer and we also partner with other solar companies. See our disclosures.

Cambridge questions

My array faces the back yard in a conservation district. Full hearing?
Not necessarily. Historical Commission staff can issue a Certificate of Non-Applicability for work not visible from any public way, which is the fastest route for rear facing arrays. Confirm your address status through MyCambridge or at 617-349-4683.
What does the electrical permit cost for a PV system?
Cambridge prices photovoltaic work at $100 per array plus $10 per 100 amps on the electrical wiring fee schedule. The building permit is separate, at $15 per $1,000 of construction cost for buildings of three dwelling units or less, with a $50 minimum.
Is the Cambridge Solar Assistance Program a homeowner rebate?
No. It serves businesses, nonprofits, and owners of commercial and large residential buildings with at least 25 kW of solar potential, roughly 2,500 square feet of roof, through partner Resonant Energy. It is not a single family incentive.
Do full state net metering caps block a Cambridge rooftop?
A Class I renewable facility of 25 kW or less nameplate is cap exempt under 220 CMR 18.02 and D.P.U. 23-140-A, so a typical rooftop system net meters even when general program caps are full.
Can a 2026 installation still claim the federal 25D credit?
No. The credit ended for expenditures made after December 31, 2025, and an expenditure counts as made when installation is completed. A system finished in 2026 does not qualify even if it started in 2025. Pre 2026 carryforwards continue.

Request an estimate

We are a solar installer and we also partner with other solar companies. Read our disclosures.

What does your monthly electric bill look like?

massachusetts average is $167 per month (EIA, 2024).