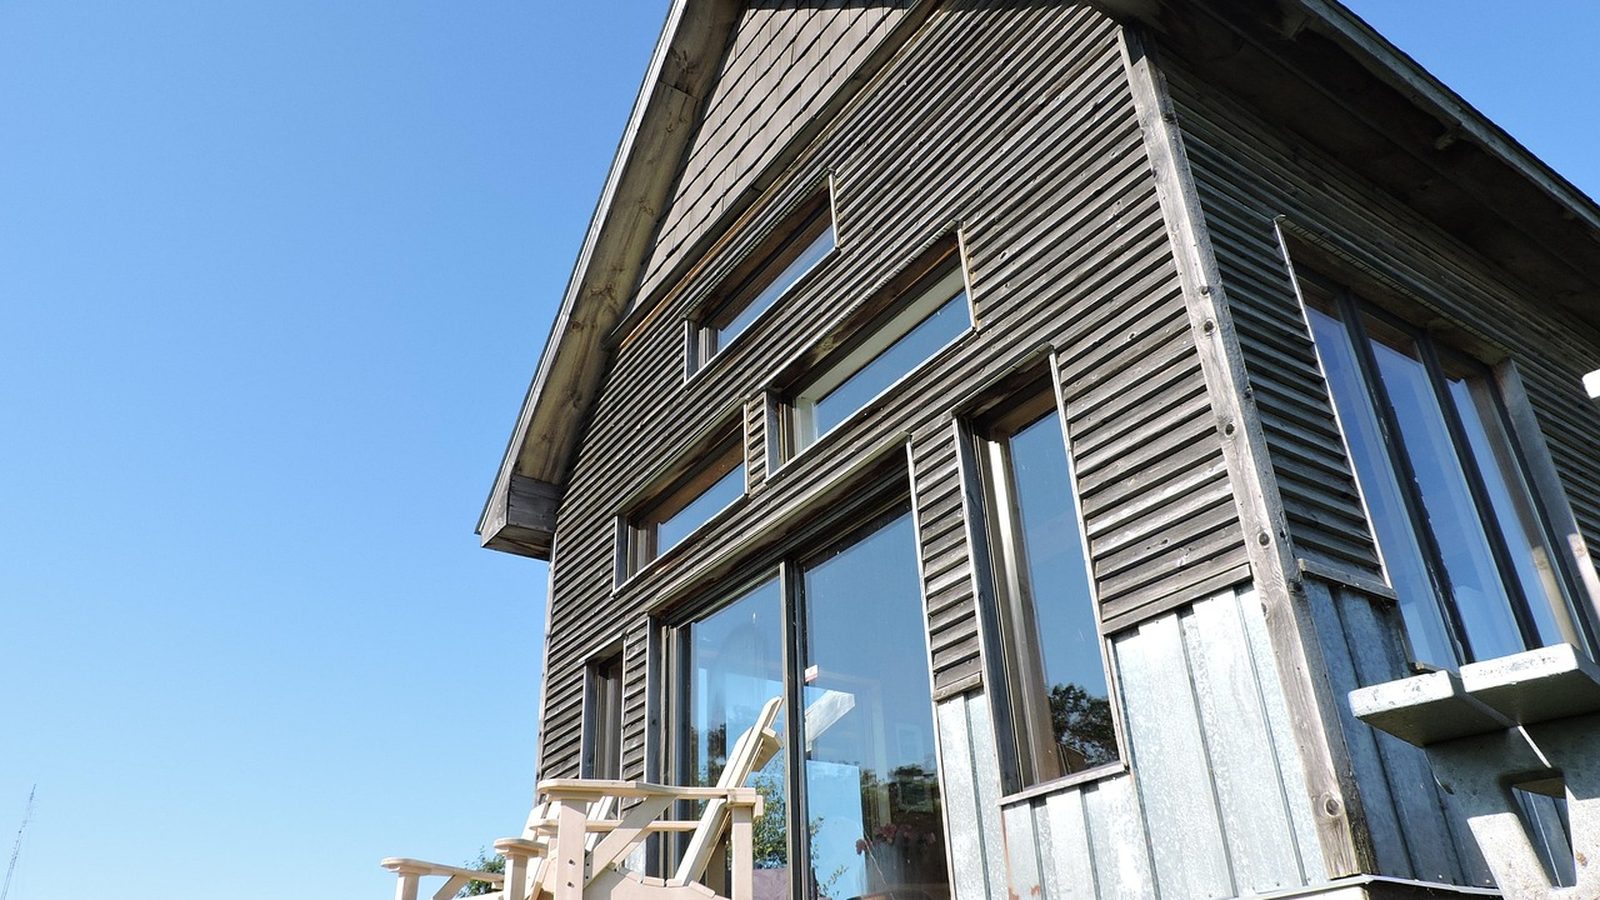
Photo: legion51, via Pixabay
Massachusetts · Springfield
Solar in Springfield: expensive power, generous programs, old roofs
Written by the Solar Learning Lab research deskUpdated August 29, 202611 min read
Springfield earned the nickname City of Homes for its Victorian residential architecture, and those homes now buy seriously expensive electricity. The Eversource entity that EIA reports for this territory averaged 29.9 cents per kWh in 2024 across 383,373 residential customers. Western Massachusetts has its own rate history, so a Springfield savings model should start from that number, not from a Boston figure or a statewide blend.
High rates alone do not make a market. What makes Springfield genuinely interesting is the stack on top: full retail net metering for typical residential systems thanks to a 25 kW cap exemption, a flat SMART 3.0 payment on every kWh generated, and a battery program that writes checks worth up to $1,375 a year. Few American cities let a homeowner layer three verified income streams on one roof. This one does.
Stack the three income streams
Our estimator starts from the 2024 Eversource average and Springfield's own production run. Add SMART and battery income on top.
Estimate Springfield savingsRead the roof before you read the tariff
Springfield's housing stock is its brand and its complication. Much of it is Victorian, including the Painted Ladies the nickname celebrates, per the city's profile. The city also averages 40.5 inches of snow a year, most of it from mid December to early March, with nor'easters capable of dumping serious accumulation. A century-old roof structure carrying snow load plus an array is an engineering question, not a sales question. Any Springfield quote that skips a structural look at the rafters is incomplete.
The demographics demand honesty too. The 2023 ACS puts median household income at $51,339 across 58,046 households, with 49.5 percent owner occupancy. This is a working city, third largest in Massachusetts at 155,929 residents in 2020, not a wealthy suburb. The programs below matter precisely because they let households without spare cash reach the same economics that wealthier towns get, including a doubled SMART rate for low income customers.
Eversource owns the wires. Your supply may come from the city's program.
Springfield launched a Community Choice Power Supply Program under the state aggregation statute: City Council Order 7109 approved in December 2022, an aggregation plan approved June 2024, and a supply agreement with First Point Power effective December 2025, per the city's program page. Default customers now get supply through the aggregation unless they opt out, which is free at any time through colonialpowergroup.com/springfield or (888) 875-1711. The city itself cautions the aggregation rate may not always beat Eversource Basic Service, and the page references Eversource rates effective August 1, 2026.
For solar purposes, keep the layers straight. Delivery, interconnection and net metering all still run through Eversource regardless of who supplies the energy. What the aggregation changes is the supply price your savings model should use. An installer quoting Basic Service math to an aggregation customer is starting from the wrong number, and in a stack this sensitive, the wrong starting number compounds for twenty years.
Why your rooftop system skips the net metering queue
Massachusetts net metering has caps, and larger projects genuinely wait in line for allocations through MassACA, the System of Assurance the DPU created, taking applications since January 24, 2013, per the state's net metering guide. Here is the sentence that matters for a Springfield homeowner: a Class I facility of 25 kW or less is cap exempt. A typical residential rooftop system can net meter even when the general caps are full, no MassACA allocation required.
That exemption is worth real money because netting happens against retail-priced power. Every kWh your panels push back cancels a kWh you would have bought at Springfield prices. In cheap-power states, net metering is a nice feature. At roughly 30 cents, it is the engine of the whole project. Systems above 25 kW serving on-site load have a separate exemption path for interconnection agreements dated January 1, 2021 or later, but for a house, you will simply never touch the cap system.
SMART 3.0: a flat payment on every generated kWh
The state rebuilt its solar incentive between 2023 and 2025, filed final SMART 3.0 regulations under 225 CMR 28.00 on August 28, 2025, effective September 12, 2025, then filed emergency regulations June 26, 2026. Program Year 2026 opened for applications January 1, 2026 with 600 MW AC of capacity for units subject to the cap, per the DOER program page.
The residential terms are refreshingly simple. Systems of 25 kW AC or less earn a flat $0.03 per kWh generated. Low income customers earn $0.06. Generated, not exported, which means the payment rides on top of whatever your net metering already does. On our modeled Springfield production, that is a steady drip of program income that requires nothing from you after enrollment. Larger projects chase adders, from $0.03 building mounted to $0.08 canopy, plus a $0.04 storage multiplier, but those are mostly commercial concerns. Questions go to doer.smart@mass.gov.
| Energy source | Type | Average price | What that means |
|---|---|---|---|
| Eversource entity, this territory | 2024 residential average | 29.91¢ per kWh | EIA Table 6, across 383,373 residential customers. What a net metered kWh is worth here. |
| SMART 3.0, 25 kW or less | flat generation payment | 3¢ per kWh generated | Paid on production, stacking on top of net metering credits. |
| SMART 3.0, low income | flat generation payment | 6¢ per kWh generated | Doubled rate for qualifying low income customers. |
| Onsite solar | self-consumed or netted kWh | near retail value plus SMART payment | Retail netting for cap exempt systems means consumed and exported kWh land close together in value, unusual among states. |
EIA Table 6 and SMART 3.0 program details. Confirm current rates at enrollment; SMART values reset off prior year netting credit averages.
ConnectedSolutions: the battery earns its keep in summer
Add storage and a third stream opens. Mass Save's ConnectedSolutions program pays $275 per kW of a battery's average contribution during summer demand response events, up to $1,375 per year for a battery sustaining 5 kW. The event rules are specific: June 1 through September 30, non-holidays, 3 p.m. to 8 p.m., no more than 60 events per summer, three hours maximum each. Eligibility requires being an existing Eversource, National Grid or Cape Light Compact customer with an inverter under 50 kW.
The honest caveat: your battery belongs partly to the grid on those summer afternoons, since the program is dispatching it during events. If backup during a nor'easter outage is your priority, discuss reserve settings with the installer before enrolling. The two goals coexist, but only if somebody configures for both, and that conversation is free before the contract and expensive after.
The permit fee is three cents a watt. Really.
Springfield's electrical fee schedule, set under Section 12.08.130 of the city ordinances effective July 1, 2012, prices alternate power sources, solar included, at $0.03 per watt with an $80 minimum for residential work. A 7 kW system pencils to $210. A service change adds $0.30 per amp with an $80 floor, so a 200 amp upgrade is $80. Filing runs through Code Enforcement's Electrical Division at 70 Tapley Street, (413) 787-6040, and per the department's payment rules, fees are check or money order only. No cash.
Two flags for accuracy. Both posted fee schedules date to 2012, so have your contractor confirm current amounts with the department before treating those figures as gospel. And no fetched city page shows an automated or instant solar permitting lane, so this is a traditional filing with a human review behind it.
The production math respects winter
Our downtown Springfield PVGIS run models 1,311.6 kWh per installed kW per year, the lowest of the five cities we published this week. July leads at 138.3 kWh per kW; December manages just 64.0, less than half. That December trough is snow cover and short days doing exactly what New England winters do.
July models 138.3 kWh per kW against a 64.0 December. Springfield economics survive that swing because each kWh is worth so much.
PVGIS v5.2 model run by Solar Learning Lab on August 29, 2026, NSRDB radiation database. Fixed south facing mount, 30 degree tilt, 14 percent losses, downtown Springfield coordinates. Your roof will differ. Method at PVGIS. Here is the counterintuitive part: modest production plus expensive electricity beats abundant production plus cheap electricity in most payback tables. A Springfield kWh offsets roughly 30 cents and earns a SMART payment besides. Sunbelt cities would trade for that arithmetic.
The firms working Springfield rooftops
Our review pulled five companies serving Springfield from bases in Holyoke, Westfield, Ludlow, Springfield itself and Enfield just over the Connecticut line. Review counts run from 36 to 395. Western Massachusetts is a smaller installer pond than Greater Boston, which makes checking each firm's SMART enrollment track record and structural experience with older housing stock the two highest-value questions you can ask.



Trio Solar
Enfield, CT
5.0(36 Google reviews)
Ratings snapshot: Google Maps, August 2026, via the DataForSEO SERP feed. Zero companies paid us and none are endorsed by us.
Add one more: ask how they handle snow load calculations on pre-war framing. A bidder who has re-decked Victorian roofs before installing will answer in specifics. A bidder who has not will answer in reassurances.
Stack the numbers yourself
The estimator uses the 2024 EIA average for this Eversource territory and Springfield's own production model. It approximates the SMART payment but cannot model aggregation supply pricing or ConnectedSolutions income, so treat the result as the conservative middle of your range.
The 1,312 top of the slider is our downtown Springfield PVGIS run, the lowest of the five cities we modeled this week. The 1,115 floor is an 85 percent case for shade, snow and orientation.
Cash quotes in Springfield cluster near $3.50 per watt, against a $3.50 national 2024 median (LBNL). Use your quote.
Assumptions you can change
Use the rate on your actual lease or PPA quote. There is no published statewide average we trust enough to hardcode.
Cash purchase
$16,850 after state credit
- Year 1 benefit
- $183/mo
- Payback
- 8 years
- 20 year net position
- $35,530
Springfield stacks retail net metering for cap exempt systems, a flat SMART payment on every generated kWh and roughly 30 cent grid power. The stack is strong, but this tool models it only approximately.
Solar loan
$206/mo 15 yr payment
- Year 1 net
- -$23/mo
- Upfront
- $0
- 20 year net position
- $15,217
Half of Springfield households rent and incomes trail the state, so lenders push hard here. Compare any dealer loan against a credit union quote and demand the cash price in writing first.
Lease / PPA
$0 down you buy the power
- Year 1 net
- $33/mo
- Upfront
- $0
- 20 year net position
- $11,466
The federal homeowner credit ended for systems completed after December 31, 2025, and our source is silent on third party tax claims. A Springfield lease must stand on its rate versus your supply and delivery charges.
Estimates, not quotes. Inputs use the 2024 EIA average for the Eversource entity covering western Massachusetts, our Springfield PVGIS run and state cost benchmarks. Aggregation supply pricing, SMART enrollment and roof condition are not modeled. We are a solar installer and we also partner with other solar companies. See our disclosures.
We are a solar installer and we also partner with other solar companies.
Springfield questions, straight answers
Do I need a net metering cap allocation for my house?
What does SMART 3.0 pay a Springfield homeowner?
Is my electricity supplier Eversource or First Point Power?
How much does a battery earn in ConnectedSolutions?
What is the solar permit fee?
Will solar raise my Springfield property taxes?
Springfield source ledger
Reviewed August 29, 2026. Each claim above ties to one of these documents.
- Springfield electrical fee schedule, building permit fee schedule, and Code Enforcement forms page
- Springfield Community Choice Energy Program
- Massachusetts net metering guide and MassACA System of Assurance
- SMART 3.0 program details, Mass Save ConnectedSolutions, and Clause 45 abatement guidance
- CRS IN12611, EIA Table 6, Springfield profile, and PVGIS
Get a Springfield quote that prices the full stack
Your bill, your roof age and your interest in a battery are the three inputs that change everything here. Start with those.
What does your monthly electric bill look like?
Springfield average is $167 per month (EIA, 2024).