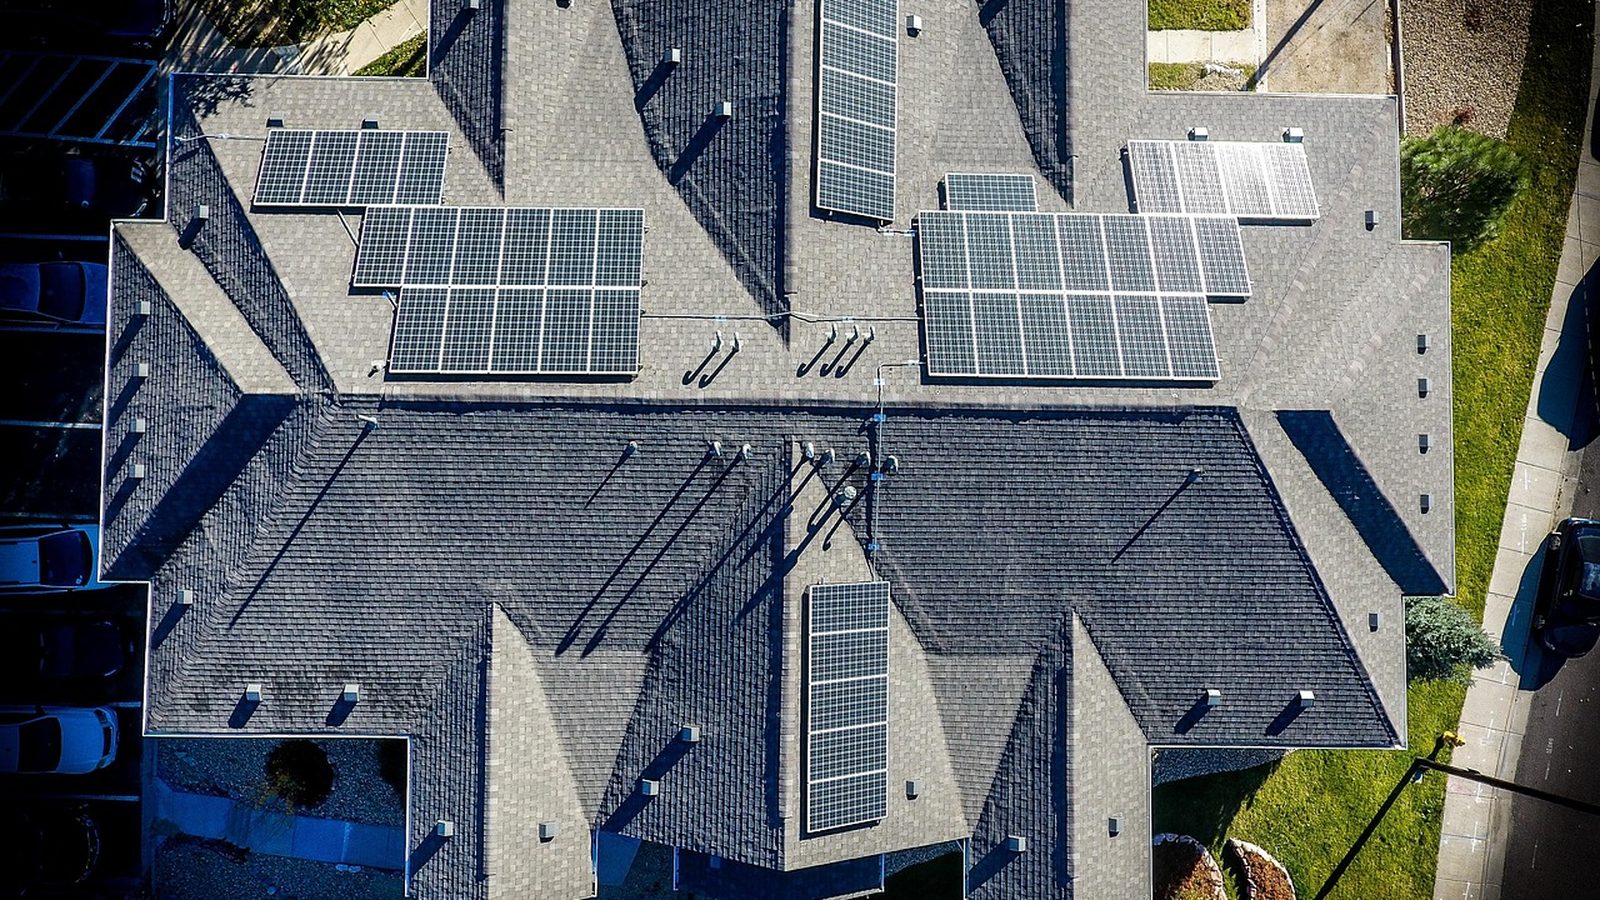
Photo: ecosolarceo, via Pixabay
California · Antioch
Antioch solar: one utility, real heat, a $316 permit
Written by the Solar Learning Lab research deskUpdated August 25, 202610 min read
Drive a few miles from Antioch in almost any direction and you cross into MCE territory. Pittsburg has it. Oakley has it. Richmond has it. Antioch does not. Here PG&E sells the generation and runs the wires, full stop, which strips a whole layer of export-credit fine print out of the solar decision. What it leaves behind is a blunter question: how much of a hot, air-conditioned summer can a roof actually offset.
This page works that question with primary documents: the City's own permit pages, the adopted fee schedule, PG&E's March 2026 rate sheet and a production model we ran ourselves. No borrowed averages from other towns, and no pretending a CCA bonus exists here when it does not.
Size it against your summer bills
Twelve months of usage beats any assumption. Use the estimator to pressure-test a system before a salesperson does the sizing for you.
Run the Antioch estimatorEast Contra Costa's no-CCA island
The map is genuinely odd. MCE's member list for Contra Costa County includes Concord, Danville, El Cerrito, Hercules, Lafayette, Martinez, Moraga, Oakley, Pinole, Pittsburg, Pleasant Hill, Richmond, San Pablo, San Ramon, Walnut Creek and the unincorporated county. Antioch is absent. The CalCCA statewide service-area document does not list Antioch under any CCA either, and PG&E's own CCA page confirms the pattern. Antioch households buy both generation and delivery from PG&E.
Why should a solar shopper care? Because MCE attaches real money to exports for its customers: a Solar Bonus Credit, an Energy Export Bonus Credit, CARE and FERA solar credits, storage credits. Those programs are available a few miles away and unavailable at an Antioch address. Any proposal that quietly imports CCA credit assumptions from a neighboring city is wrong on arrival. In practice we see this exact error in template-driven quotes more often than you would expect.
The flip side is simplicity. One company, one bill, one set of tariffs. For a homeowner comparing quotes, that removes an entire category of confusion that Richmond and Pittsburg customers have to untangle.
The payback engine is the air conditioner
Antioch sits on the boundary between the Bay Area and the Central Valley, and its weather acts like it. The climate record shows mean daily highs of 91.1 F in July and 89.9 F in August, with a record of 117 F. Four months of the year post mean daily highs at or above 86 F. That is not Richmond's bayside mildness. It is cooling-load country.
Now line the heat up against the tariff. PG&E's residential pricing effective March 1, 2026 puts the E-TOU-C summer peak at 52 cents per kWh between 4 and 9 p.m., and E-ELEC's summer peak at 55 cents. The hours when an Antioch house runs its AC hardest are the hours PG&E prices highest. Solar that serves that load directly, or a battery that shifts midday production into the evening peak, is doing its most valuable work exactly when the meter is most expensive.
| Energy source | Type | Average price | What that means |
|---|---|---|---|
| PG&E E-1 | tiered default | 33¢ to 41¢ per kWh | Tier 2 starts once usage passes the baseline allowance. |
| PG&E E-TOU-C | time-of-use, peak 4 to 9 p.m. | 32¢ to 52¢ per kWh | The summer peak price is the number an AC-heavy household should study. |
| PG&E E-ELEC | electrification rate | 28¢ to 55¢ per kWh | Carries a Base Services Charge on top of energy prices. |
| Solar used onsite | avoided purchase | varies by hour retail value | A kWh consumed behind the meter avoids whichever price applies that hour. |
PG&E residential rate plan pricing, March 1, 2026. Snapshot, not a bill forecast.
The housing stock leans the same direction. The state's 2026 estimate counts 30,347 single detached homes out of 39,022 total units in Antioch, a 77.8 percent detached share, with 3.12 persons per household. Bigger detached homes, more people, hot summers: that is the profile where rooftop solar earns its keep through self-consumption rather than exports. The Department of Finance table has the counts.
$316 to the City, and a lane you have to stay inside
Antioch's adopted fee schedule lists the residential solar photovoltaic permit at a flat $316.00, effective July 1, 2025. That sits comfortably under the $450 statutory cap that Government Code 66015 sets for systems up to 15 kW. Note the stacking, though: the SolarAPP+ platform adds its own $35 processing fee, plus $25 more when a battery is included. A quote that says the permit costs $316 and stops there is understating the government cost. The Master Fee Schedule and the City's Solar Permits page hold the line items.
The workflow runs through two systems, and the distinction matters. SolarAPP+ performs the plan review and issues the approval documents. The City's Citizen Access portal takes the payment and issues the actual permit. Once documents are uploaded and fees are paid, the Instant Solar permit issues automatically and the job card prints from the portal. That is the fast lane the state pushed cities toward under Government Code 65850.52, which reaches residential systems up to 38.4 kW AC. The CEC's tracking workbook records Antioch as a SolarAPP+ Platform jurisdiction with an $80,000 CalAPP award from May 2023, and Antioch appears in NREL's availability table.
Three lane rules that catch people. First, the instant path is for registered contractors only; owner-builders go through the standard Building Division submittal. Second, projects outside the City's eligibility checklists fall out of the automated lane entirely. Third, and this one causes avoidable repeat visits: if the printed SolarAPP+ Inspection Checklist, single-line diagram and permit card are not physically on site at inspection, the inspection automatically fails. Inspections book in Citizen Access with AM and PM windows, 9 to noon and noon to 3.
One more sequencing trap from the City's own FAQ: a re-roof on a house with existing panels needs two permits, a re-roof permit plus a solar removal and reinstallation permit. Roofers and solar crews who have not coordinated before the tear-off are how that job becomes a saga.
What one installed kW produces in Antioch
Our PVGIS model for downtown Antioch comes out at 1,697.0 kWh per year for each installed kW. August is the strongest month at 182.3 kWh per kW, July right behind it at 182.0, December the floor at 85.6. The summer bulge lands on top of the cooling season, which is the alignment you want in a self-consumption market.
August models at 182.3 kWh per kW, the annual high, arriving in the same weeks the air conditioning works hardest. Whether that production stays behind the meter depends on who is home and when.
PVGIS v5.2 model run by Solar Learning Lab on August 25, 2026, NSRDB radiation database. Fixed south facing mount, 30 degree tilt, 14 percent losses, downtown Antioch coordinates. Your roof will differ. The run used the PVGIS tool. Treat it as a standardized yardstick between cities, not a promise about your roof. Orientation, shade, panel spacing and equipment all move the real number.
Exports here follow the state tariff, with nothing added
New Antioch interconnections fall under the Net Billing Tariff, adopted in CPUC Decision D.22-12-056 and applied to applications submitted on or after April 15, 2023. Export compensation under that framework is not the retail rate. The CPUC's program page carries the statewide rules, and our California page covers them at length, so we will not repeat the mechanics here.
What is specifically true in Antioch: there is no CCA layer to sweeten exports. No Solar Bonus Credit, no Energy Export Bonus Credit, no CCA storage credit. The design consequence is direct. Oversizing a system to farm export credits is a weaker strategy here than almost anywhere in Contra Costa County. Size to the household's consumption, weight the evening peak, and let exports be a byproduct rather than the plan. For context, PG&E's average residential price across 2024 was 39.617872 cents per kWh in EIA's bundled sales data, which is the scale of what self-consumed solar avoids.
The programs still standing in 2026
Start with what ended. The federal 25D homeowner credit was repealed for expenditures after December 31, 2025, and the controlling date is when installation is completed, not when the contract was signed or paid. An Antioch project finishing in 2026 gets no 25D credit. CRS report IN12611 spells this out. Any pitch that still leads with a 30 percent federal credit for a purchase closing this year is describing a program that no longer exists for that buyer.
What remains is targeted. SGIP's Residential Solar and Storage Equity budget pays $3,100 per kW for solar and $1,100 per kWh for storage, open to low-income residential customers statewide, with reservations open since June 2, 2025 and $280 million authorized. Reservation holders get one year to meet requirements, including enrollment in a qualified demand response program. The CPUC SGIP page is the entry point. Separately, DAC-SASH runs through 2030 for households in the top 25 percent most disadvantaged communities by CalEnviroScreen who meet CARE or FERA income rules, administered by GRID Alternatives. Eligibility is address-specific, so check before anyone books it as savings.
We found no Antioch-run rebate on any City page we reviewed. The City's $80,000 CalAPP grant funded its permitting platform, not homeowner checks.
Who actually bids Antioch jobs
Much of the installer base serving Antioch operates out of Brentwood next door. That is normal for East County and not a red flag. What you should verify per bidder: an active CSLB license, whether the design fits Antioch's SolarAPP+ eligibility checklist, and who eats the cost if a battery or layout change pushes the job into standard plan review.
Del Sol Energy
Brentwood, CA
4.8(107 Google reviews)
United Solar Electric
Brentwood, CA
4.8(72 Google reviews)
HomePro Solutions Solar Company
Brentwood, CA
4.9(71 Google reviews)
Solar Harmonics
5.0(68 Google reviews)
Ratings snapshot: Google Maps, August 2026, via the DataForSEO SERP feed. Zero companies paid us and none are endorsed by us.
One sorting question that separates crews quickly: ask how they handle the printed-document requirement at inspection. An installer who knows Antioch answers in one sentence. An installer who has never worked here asks what you mean.
Screen the numbers before anyone screens you
The estimator below uses our Antioch production run and statewide rate and cost inputs. It is a comparison tool for system sizes and payment paths, not a simulation of PG&E's hourly export values. Run it, then make the winning bidder reconcile their number against yours line by line.
The upper bound is our Antioch PVGIS model at 1,697 kWh per installed kW. The lower bound trims that by 15 percent to stand in for a less favorable roof plane or partial shade.
Cash quotes in Antioch cluster near $2.46 per watt, against a $3.50 national 2024 median (LBNL). Use your quote.
Assumptions you can change
Use the rate on your actual lease or PPA quote. There is no published statewide average we trust enough to hardcode.
Cash purchase
$8,364 after state credit
- Year 1 benefit
- $160/mo
- Payback
- 5 years
- 20 year net position
- $38,192
Antioch has one electricity seller: PG&E handles both generation and delivery, with no CCA layer and no CCA export bonuses. That makes the math simpler than in Pittsburg or Richmond, but the export side still follows the Net Billing Tariff, which this screening tool cannot model hour by hour.
Solar loan
$112/mo 15 yr payment
- Year 1 net
- $48/mo
- Upfront
- $0
- 20 year net position
- $26,422
Financed Antioch quotes should break out the cash price, the dealer fee and the prepayment terms as separate lines. If the lender will not show the spread between cash and financed pricing, that spread is the answer.
Lease / PPA
$0 down you buy the power
- Year 1 net
- $44/mo
- Upfront
- $0
- 20 year net position
- $14,566
Under a lease or PPA the provider owns the system and whatever tax position comes with ownership. Your only question is whether the contract rate and its escalator beat the PG&E bill you would otherwise pay, every year of the term.
Estimates, not quotes. This tool combines the California average retail rate, our downtown Antioch PVGIS run and statewide cost inputs. It does not simulate PG&E time-of-use periods, Net Billing Tariff export values or your roof's shading. We are a solar installer and we also partner with other solar companies. See our disclosures.
We are a solar installer and we also partner with other solar companies.
Antioch questions, answered from the documents
Is Antioch served by MCE or any other CCA?
What does the City charge for a residential solar permit?
Can I permit my own DIY install through the instant path?
Why do Antioch solar inspections fail?
I need a new roof and I already have panels. One permit or two?
Does the 30 percent federal credit still apply in Antioch?
Document trail
Every claim above traces to one of these primary documents, all reviewed for this page on August 25, 2026.
solarPermits · buildingDivision · permitPortal · cityFaqs · feeSchedule · feeCap · sb379 · cecTracker · solarAppMap · pgeTerritory · pgeCca · pgeRates · mceArea · mceSbp · calCca · eia · cpucNbt · sgip · dacSash · federal · climate · housing
Get an Antioch estimate anchored to your usage
Start from your bill and roof, not from a template. The output arms you for the contractor conversation.
What does your monthly electric bill look like?
Antioch average is $167 per month (EIA, 2024).