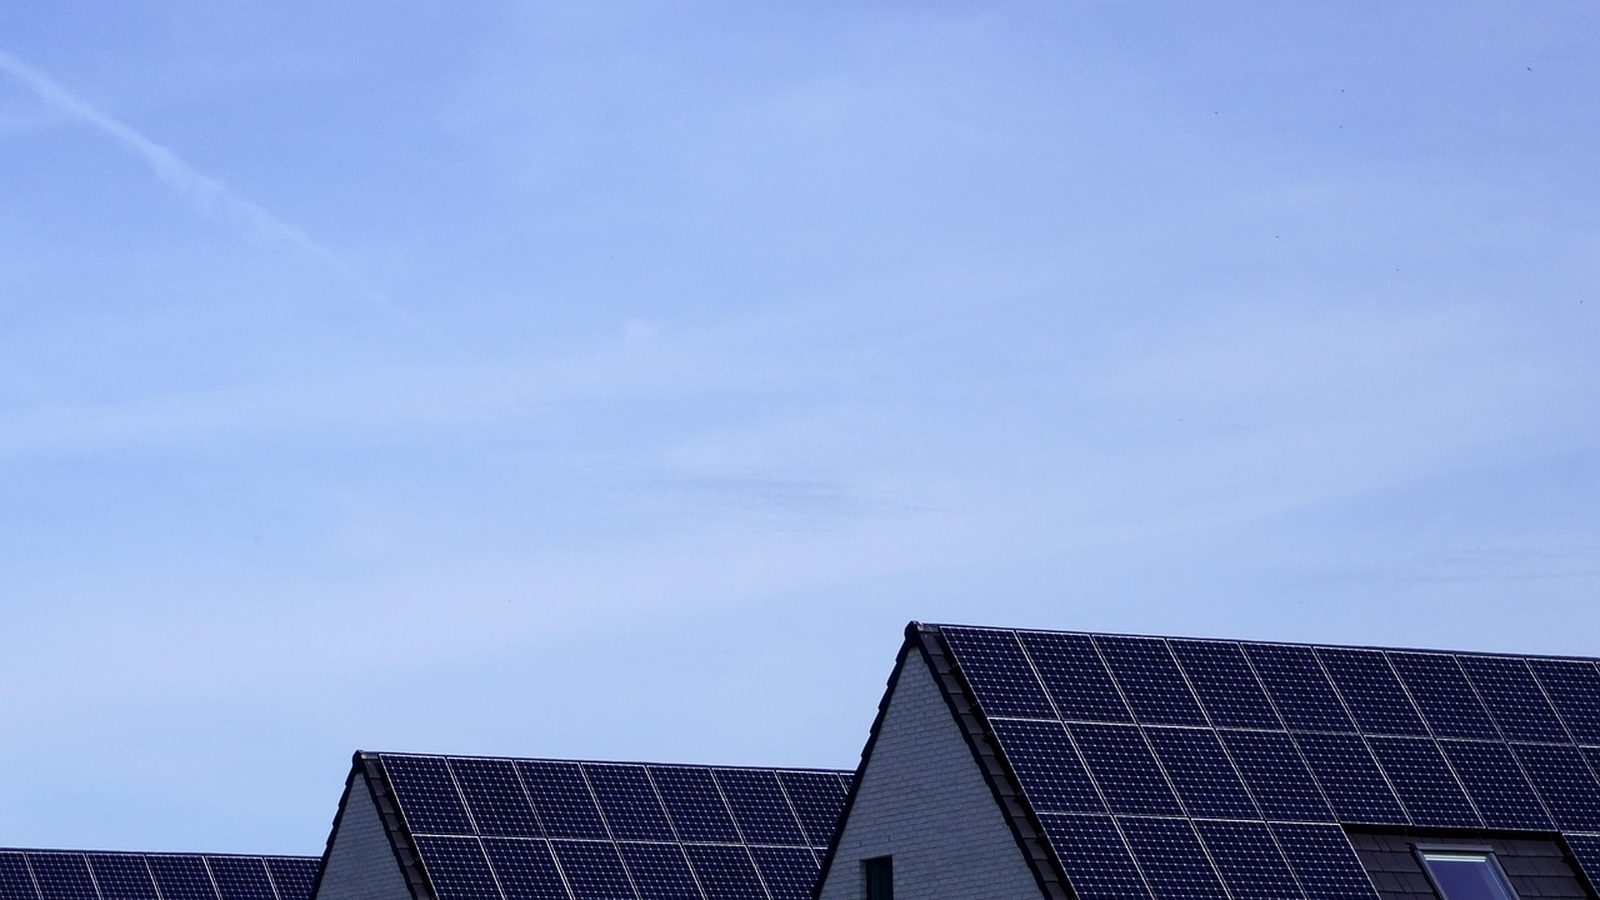
Photo: Janvanbizar, via Pixabay
California · Fremont
Solar in Fremont: the permit office acts like it has seen solar before
Written by the Solar Learning Lab research deskUpdated August 22, 202611 min read
Fremont does not treat residential solar like an exotic construction event. Its Instant Solar Permit can cover roof-mounted PV with or without energy storage and can include a main electrical service upgrade. For an eligible job, the permit auto-issues after uploads and payment. The fee is $133 up to 15 kW, versus $280 for the conventional residential solar permit. This is what a mature permitting system looks like.
The rest of the job is still California solar. PG&E runs delivery and billing, Ava Community Energy supplies generation, Fremont now defaults most residential customers to Renewable 100, and new exports live under the Solar Billing Plan. A fast City permit does not change export value. It does remove a very common source of unnecessary project friction.
Model a Fremont solar starting point
Check production, system scale and financing assumptions before comparing bids. Then make the contractor explain hourly export value.
Estimate a Fremont systemFremont has spent more than a decade making solar ordinary
The City's solar posture is not a recent marketing campaign. Fremont adopted its Renewable Energy Ordinance in 2012, reduced residential solar permit fees and set streamlined processing rules. The solar ordinance limits permit turnaround for small rooftop systems to three days. In 2024, Fremont became SolSmart Platinum after previously holding Gold with a Special Award for Excellence in Permitting. The City's solar page calls it the first community in the country to reach that Platinum level.
Numbers show what an established local process can compound into. Fremont reports solar permits rising from 777 in 2020 to 1,010 in 2021 and 1,188 in 2022. By the end of 2023, it counted 9,801 residential and 161 commercial or industrial sites with PV, totaling 67 MW of PV plus 5.47 MW of storage. That does not make a particular roof good. It does mean the City's counter staff, inspection process and local electrical trade are operating in a place where this work is normal. Fremont's adoption data.
There is a useful contrast with interior Central Valley markets. Fremont's nearest long-term station, Hayward Air Terminal, shows 1,651.2 cooling degree days at base 57 and a 59.6 F annual mean. The summer load can still be substantial, but the solar case leans more heavily on high retail power prices and careful load timing than on relentless air-conditioning use. NOAA's nearby climate normals provide the weather context.
The housing inventory is more mixed than a drive through a single-family neighborhood might suggest. State estimates count 44,999 single-detached homes out of 82,658 housing units, while 23,423 units are in buildings with five or more homes. That means a lot of Fremont households will not control a roof. For owner-occupied detached homes, however, an institutional permit process removes one of the variables that is often a headache elsewhere. California's E-5 housing data is the source for that mix.
The $133 Instant Solar Permit is the real Fremont advantage
Fremont implemented the Instant Solar Permit in 2023 using an automated residential plan-review platform. A qualifying project is submitted through Citizen Access, then auto-issued once the required documents are uploaded and fees are paid. The City explicitly says there is no City plan review for this record. That is stronger than a vague “expedited” badge. It is a stated operating method. Fremont's ISP page has the workflow.
Scope matters. The ISP is for roof-mounted PV with or without an energy storage system. A main electrical service upgrade may be placed on the same permit. Contractors must be registered with the automated review platform. Required uploads include the platform approval documents, inspection checklist, Fremont Homeowner Acknowledgement form, proof of ownership for a recently transferred property and a UL 9540 test report for stacked energy storage systems. It is fast because the input package is standardized, not because the City has stopped caring about the details.
The July 2026 Master Fee Schedule sets the ISP at $133 up to 15 kW, including application, plan check and inspection. Above 15 kW, it is $133 plus $7.50 per kW. The conventional residential solar fee is $280 up to 15 kW and $280 plus $15 per kW above that. Auto-issued Express records, including ISP, are exempt from the Building Permit Application Fee. The Master Fee Schedule is unusually clear on this comparison.
The single ISP payment covers two inspections of the same element. Further visits are re-inspections at $133 each. The City's streamlining ordinance provides for one inspection for a small rooftop system, so the right practical reading is not “inspections are free.” It is “get the job ready the first time.” The City also lists a 2 percent non-refundable convenience charge for online card payments. These are small costs compared with a system price, but they are a good test of whether a quote has been built from the current rules.
A conventional permit has its place if the job does not fit. Fremont's three-day cap for small rooftop permits remains meaningful, but nobody should quote the $133 price or automatic issuance before checking the project against ISP eligibility. Fast permitting rewards a clean scope. It does not excuse careless sales design.
Renewable 100 is the Fremont default. PG&E still bills the account.
Fremont City Council voted in June 2024 to make Ava's Renewable 100 the default generation plan. The residential transition finished in August 2025. Renewable 100 is described as 100 percent renewable and priced at 1.75 cents per kWh above PG&E generation. CARE, FERA and Medical Baseline customers default to Bright Choice instead. Ava supplies generation; PG&E handles delivery and billing. Ava's Fremont page and the City announcement spell out the transition.
| Energy source | Type | Average price | What that means |
|---|---|---|---|
| PG&E E-ELEC | Solar Billing Plan retail rate | 28¢ to 55¢ per kWh | The 4 to 9 p.m. summer period is 55¢; solar customers are placed on E-ELEC. |
| PG&E E-TOU-D | residential TOU reference | 34¢ to 48¢ per kWh | Summer peak is 5 to 8 p.m. on weekdays. |
| Ava Renewable 100 | generation default | 1.75¢ above PG&E generation per kWh | The generation adder does not replace PG&E delivery charges. |
| Onsite solar | immediate household use | retail value avoided not a fixed export rate | Production used as it is made avoids a retail purchase; exported production receives different credits. |
PG&E's March 2026 residential pricing sheet and Ava's Fremont service information.
For a new PG&E interconnection, exports are governed by the CPUC Net Billing Tariff, branded by PG&E as the Solar Billing Plan. This page will not replay the generic statewide explainer. The Fremont-relevant point is operational: onsite generation serves onsite load, exports receive hourly energy export credits, credits roll through monthly billing to annual true-up, and residential Solar Billing Plan customers are placed on E-ELEC. PG&E lists a $145 interconnection fee. PG&E's program page and the CPUC overview carry the current formal terms.
Ava publishes a 2026 standard residential Energy Export Bonus Credit of 0.9 cents per kWh for nine years, with a 3.6-cent figure for eligible income-qualified customers. It also lists a 1-cent export bonus for CARE and FERA customers and a 2.5-cent bonus for non-CARE and non-FERA exports from 3 to 8 p.m. These can improve a well-designed system. They are not a substitute for load matching or a reason to treat every exported noon kWh as a retail kWh. Ava's Solar Billing Plan page has the eligibility details.
A Fremont model has a summer peak, not a blank check
Our PVGIS run for downtown Fremont produces 1,658.4 kWh per installed kW annually. July is the modeled high point at 173.6 kWh per kW; January is 100.8. The annual total is close to Stockton and Modesto. The household economics differ because Fremont's climate, tariffs and energy use differ. That is why a city-specific production model is only the opening page of a quote review.
July is the modeled high month at 173.6 kWh per kW. The system's value depends on household demand when that generation lands, especially under hourly export credits.
PVGIS v5.2 model run by Solar Learning Lab on August 22, 2026, NSRDB radiation database. Fixed south facing mount, 30 degree tilt, 14 percent losses, downtown Fremont coordinates. Your roof will differ. The source is PVGIS. It uses a standardized downtown point and roof configuration. It does not see the redwood that shades an afternoon roof, the detached garage plane, electrical constraints, or a household's 5 p.m. cooking load. A site design must.
The sensible Fremont question is not “Can solar cover my annual usage?” It is “How does this particular system work with an E-ELEC account, a Renewable 100 generation plan and my actual hourly demand?” There is no need to romanticize that work. It is bill analysis. It is also where a good installer earns the price.
Here, storage fits inside the fast permit instead of fighting it
Fremont's ISP includes roof-mounted PV with or without energy storage. That is a significant local distinction. A homeowner can examine solar plus a battery, and potentially a service upgrade, within the same streamlined record if the project meets the system's requirements. Stacked storage needs the UL 9540 report, but the City has already decided that storage belongs in the solar workflow. ISP requirements.
Ava's SmartHome Battery program launched April 9, 2026 with an $11 million budget. It offers a $90 per kWh installation rebate for market-rate customers and $500 per kWh for income-qualified customers on the share enrolled in its virtual power plant, plus $3 per month per shared kWh. Customers choose a 40, 60 or 80 percent share and must own the battery. The program is first-come, first-served until the budget is committed. Ava's announcement is the document to use for current terms.
That program should not be confused with a universal battery discount. Ownership, program compatibility and enrollment share matter. Ava's prior Resilient Home program is closed to new enrollment, though it created a virtual power plant with more than 1,200 homes. Ava's Resilient Home page tells new customers to look to the 2026 offering instead.
There is also SGIP for qualifying storage projects in PG&E territory. The CPUC lists Equity incentives of $850 per kWh and Equity Resiliency incentives of $1,000 per kWh for qualifying conditions, with priority categories that include high fire-threat exposure, multiple PSPS events, low income, medical vulnerability and critical facilities. This is not a standard rebate. Ask for eligibility evidence before it appears in a net price. CPUC SGIP information.
The homeowner 25D credit ended December 31, 2025. A lease or PPA provider may claim 48E. That makes the financing form more consequential, not less. Congressional Research Service IN12611 is the policy reference. Evaluate a battery for backup, self-consumption, the Ava program and contract economics. Do not use an expired personal credit as a reason to rush.
Fremont has more local choice, but process fit still matters
The five Google Maps results below have 20 or more reviews and represent Fremont, Hayward, Santa Clara, Milpitas and Newark. That geographic spread is normal in a dense Bay Area service market. It is not an endorsement list. It is a way to start a real procurement process with companies that should be able to discuss Citizen Access, automated plan approval, E-ELEC and Ava without being coached by the homeowner.




TN Electrical and Solar Services
Milpitas, CA
5.0(121 Google reviews)

Nabu Energy
Newark, CA
4.9(81 Google reviews)
Ratings snapshot: Google Maps, August 2026, via the DataForSEO SERP feed. Zero companies paid us and none are endorsed by us.
Get bids that distinguish ISP work from conventional permitting and show whether the fee, automated review steps, service upgrade and storage documents are included. Ask for annual production, but also ask for an explanation of direct solar use, expected export behavior and how the company handles a failed inspection. A permit office this efficient makes it easier to see which installer actually has their operations together.
Use the Fremont calculator to set questions, not to replace a bill model
This calculator combines the local PVGIS output with California cost and retail-rate context. It cannot reproduce the hour-by-hour energy export credits, Ava's bonuses, the base service charge or your roof's shade. It is useful for seeing system scale and finance assumptions move. Then take the resulting size to a contractor and request the missing hourly logic.
The upper setting is our downtown Fremont PVGIS run. The lower setting is 85 percent of it, useful for testing a less favorable roof. Production is only one side of a Solar Billing Plan result.
Cash quotes in Fremont cluster near $2.46 per watt, against a $3.50 national 2024 median (LBNL). Use your quote.
Assumptions you can change
Use the rate on your actual lease or PPA quote. There is no published statewide average we trust enough to hardcode.
Cash purchase
$8,610 after state credit
- Year 1 benefit
- $161/mo
- Payback
- 5 years
- 20 year net position
- $38,225
The calculator is a first-pass estimate. Fremont's own permit process is unusually fast, but the utility side still prices exports through PG&E's Solar Billing Plan and Ava's generation program.
Solar loan
$115/mo 15 yr payment
- Year 1 net
- $46/mo
- Upfront
- $0
- 20 year net position
- $26,110
Use the California market loan setting only as a comparison point. Get the cash price, lender APR, dealer fee and term in writing. A smooth monthly payment can conceal an expensive system.
Lease / PPA
$0 down you buy the power
- Year 1 net
- $45/mo
- Upfront
- $0
- 20 year net position
- $14,654
A PPA or lease provider may claim the federal 48E business credit. That does not make every contract good. Compare its escalator and production guarantee against the energy you actually use.
Estimates, not quotes. The tool uses California rate and market-cost inputs with a Fremont PVGIS production run. It does not model hourly PG&E export values, Ava credits, fixed charges, shading or the details of a specific roof. We are a solar installer and we also partner with other solar companies. See our disclosures.
We are a solar installer and we also partner with other solar companies.
Fremont solar questions that deserve direct answers
Does Fremont have an instant solar permit?
Can the Fremont Instant Solar Permit include a battery?
How much is the Fremont Instant Solar Permit?
Is Ava Renewable 100 the default in Fremont?
Does Fremont solar use PG&E or Ava?
How much solar is already in Fremont?
Fremont source notebook
Operational claims on this page trace to these City, utility and public-program documents reviewed on August 22, 2026.
- City of Fremont Instant Solar Permit, Solar Power page, and Master Fee Schedule
- Ava Fremont service page, Ava Solar Billing Plan, and Ava SmartHome Battery announcement
- City of Fremont Renewable 100 announcement and Ava Resilient Home program page
- PG&E residential rate pricing, PG&E Solar Billing Plan, and CPUC Net Billing information
- CPUC SGIP participation page
- California Department of Finance E-5 housing estimates, NOAA Hayward climate normals, and PVGIS
- Congressional Research Service IN12611
Get a Fremont estimate that shows the actual moving parts
Share the bill range, roof conditions and payment preference. Then use the estimate to request a properly scoped Instant Solar Permit and utility model.
What does your monthly electric bill look like?
Fremont average is $161 per month (EIA, 2024).