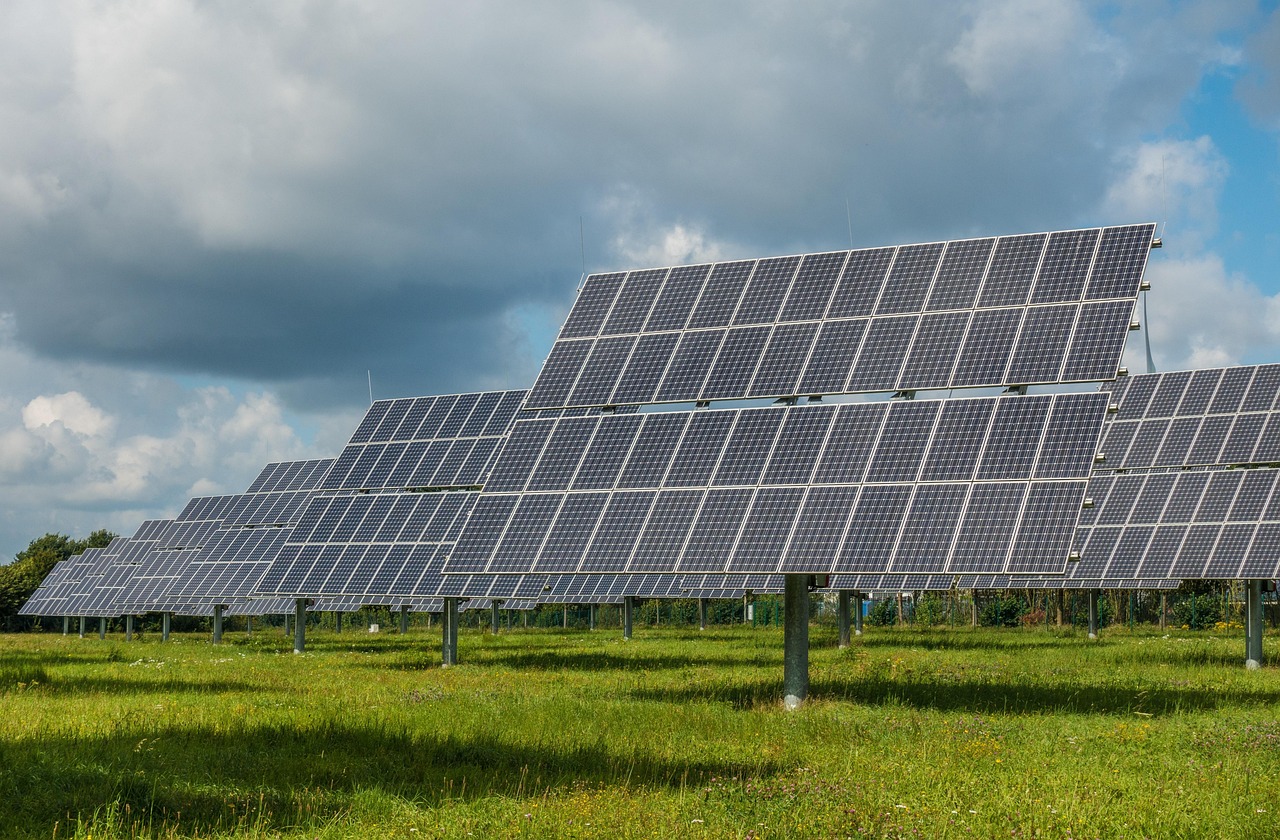
Photo: mrganso, via Pixabay
California · Lancaster
Solar in Lancaster: the desert production advantage
Written by the Solar Learning Lab research deskUpdated August 23, 202611 min read
Lancaster is the one California city where the production number should make you stop. The downtown PVGIS benchmark comes in at 1,885 kWh per installed kW each year, the highest city result on this site. The City has also spent more than a decade treating electricity as local infrastructure, not background noise. It built Lancaster Choice Energy, mandated solar on new homes before the statewide rule, and says it became a net-zero electricity community in 2019. That history is real.
It does not mean any panel count is sensible. Lancaster Energy supplies generation while SCE still owns the wires, and a high-output roof can become an export machine if the household load is too small. Start with production. Finish with the billing rules.
See whether the huge yield fits your bill
Start with timing of use and system size. Lancaster sunshine helps, but the City CCA and SCE charges decide whether the proposal holds up.
Pressure-test Lancaster solarThe desert output is a real advantage, not a blank check
A moderately sized array can produce a serious amount of electricity at this annual yield. That is the opportunity, before roof-specific adjustments. The high month in this run is May at 182.1 kWh per kW, not a vague promise of endless summer output. PVGIS makes a useful standardized comparison; it cannot see your vent pipes, trees or west-facing roof.
Lancaster has 52,183 households and a 72 percent single-family share in the 2023 ACS inputs used here. Plenty of roofs exist. The relevant question is whether the home uses electricity when panels are making it. Cooling, EV charging, pool equipment and work-from-home loads can help. An oversized array aimed at annual usage alone can still produce a mediocre bill result.
This city has been building a solar identity for years
Lancaster required an average 1 kW of solar per new single-family home beginning in 2014. In 2017, the City adopted a Zero Net Energy Home Ordinance requiring builders to install solar equal to 2 watts per square foot, with limited compliance alternatives. It later reported achieving its net-zero electricity community goal in 2019. The City's advanced-energy record is unusually specific.
That history matters because the City also runs Lancaster Choice Energy, branded Lancaster Energy. But it is history, not a personal savings guarantee. Your project gets evaluated under today's tariff and today's roof conditions.
Lancaster Energy is not a footnote to the SCE bill
Lancaster Energy replaces SCE's generation charges inside city limits, while SCE continues delivery and billing. On the published DOMESTIC comparison at 659 kWh per month, the SCE bundled amount is 37.792 cents per kWh, while Lancaster Energy Clear Choice reaches 44.310 cents. This is why a proposal that says only “SCE rate” is not adequate local math. Read the joint comparison.
| Energy source | Type | Average price | What that means |
|---|---|---|---|
| SCE bundled DOMESTIC | comparison at 659 kWh | 37.792¢ per kWh | Published SCE all-in comparison value. |
| Lancaster Energy Clear Choice | generation plus delivery comparison | 44.310¢ per kWh | Includes published CCA charges at the comparison usage. |
| Lancaster Energy Personal Choice | solar settlement | 6¢ per surplus kWh at true-up | Published surplus rebate rate; regular monthly settlement still applies. |
Source: SCE and Lancaster Energy joint rate comparison and Lancaster Energy Personal Choice.
A new interconnection sits on CPUC net-billing rules administered by SCE; Lancaster Energy then applies Personal Choice on its generation side. Net contribution is credited monthly and evaluated at an October true-up; surplus production is rebated at 6 cents per kWh. That policy is a warning against building for the biggest possible annual export.
A $250 permit and an instant lane, when the job fits
The City lists a flat $250 residential PV permit fee, plus $50 for revisions. Lancaster uses Symbium for rooftop solar and storage applications: the system checks rules and licenses, and qualifying applications can be issued without manual review or a site visit. The City's instant-permit page lays out the workflow.
Not every job is a clean fit. Applications that do not qualify go to Building and Safety staff. Battery systems have valuation-based fees, and an electrical service upgrade is listed at $100. Read the scope before calling the permit “flat” and move on.
The production curve is broad, not just hot
December still models 122.4 kWh per kW, while May reaches 182.1. That spread is narrower than many homeowners expect. It supports a year-round solar conversation, but the rate value of a solar kWh still changes with when the house consumes it.
May is the modeled high month at 182.1 kWh per kW. High output helps only when the household can use or sensibly store it.
Solar Learning Lab ran this Lancaster comparison on August 23, 2026 using PVGIS v5.2 and the NSRDB radiation database. It assumes a fixed south-facing array at 30 degree tilt with 14 percent losses at downtown coordinates. A real desert roof can produce differently. Use the PVGIS model as a common baseline, then demand a design-specific production report.
Ask the local bidders the question the desert does not answer
Lancaster and Palmdale share an installer market. That is normal for two Antelope Valley cities this close together, and the listed companies overlap. It is not a reason to copy a neighbor's system size. Ask every bidder to show the proposed self-consumption assumption, the Personal Choice treatment, roof work, service-panel scope and what changes if the permit leaves the instant lane.
Ratings snapshot: Google Maps, August 2026, via the DataForSEO SERP feed. Zero companies paid us and none are endorsed by us.
Use production as a starting point, not a verdict
Set the slider against a real Lancaster bill, then make the proposal answer three questions: how much daytime use it assumes, how it treats Lancaster Energy's Personal Choice settlement, and whether its array size creates surplus at the October true-up. This is deliberately a rough screen. The tariff and roof get the final say.
The upper end is our downtown Lancaster PVGIS production run. The lower end is 85 percent of it, a sensitivity check for roof direction, shade and layout rather than an output promise.
Cash quotes in Lancaster cluster near $2.46 per watt, against a $3.50 national 2024 median (LBNL). Use your quote.
Assumptions you can change
Use the rate on your actual lease or PPA quote. There is no published statewide average we trust enough to hardcode.
Cash purchase
$7,626 after state credit
- Year 1 benefit
- $162/mo
- Payback
- 4 years
- 20 year net position
- $39,524
Lancaster has exceptional modeled production, but Lancaster Energy and SCE charges remain on separate bill layers. This is a screening estimate, not a Personal Choice or SCE true-up calculation.
Solar loan
$102/mo 15 yr payment
- Year 1 net
- $60/mo
- Upfront
- $0
- 20 year net position
- $28,794
Get the cash price, financed price, dealer fee and prepayment terms separately. A strong desert production model does not rescue an expensive loan.
Lease / PPA
$0 down you buy the power
- Year 1 net
- $45/mo
- Upfront
- $0
- 20 year net position
- $14,753
A lease or PPA should be compared against your actual Lancaster Energy and SCE bill, with escalation language and end-of-term options in writing.
Estimates, not quotes. Lancaster's screen uses California market inputs and the local PVGIS output, but it cannot map SCE delivery timing, Lancaster Energy Personal Choice settlement, fixed charges or the shade on your roof. We are a solar installer and we also partner with other solar companies. See our disclosures.
We are a solar installer and we also partner with other solar companies.
Lancaster questions for a very sunny market
Why is Lancaster production so high?
Who supplies electricity in Lancaster?
What does a Lancaster solar permit cost?
Can a permit issue automatically?
Does the homeowner 25D credit still apply?
Lancaster records behind this page
The City's long solar history can make a local pitch sound effortless. It is not. These are the documents used to separate the City's policy record, its current permit lane and the two layers of the electricity bill.
Lancaster Advanced Energy Community history · Symbium instant-permit instructions · 2025 to 2026 Lancaster fee schedule · SCE and Lancaster Energy comparison · Personal Choice solar policy · Lancaster PVGIS run · CRS on the expired homeowner credit
Build a Lancaster proposal around the meter, not the sunshine
Bring the full year of usage, the roof layout, any air-conditioning or EV plans, and the current Lancaster Energy bill. Ask the bidder to show the October true-up consequence before you approve a panel count.
What does your monthly electric bill look like?
Lancaster average is $161 per month (EIA, 2024).